Fig. 13
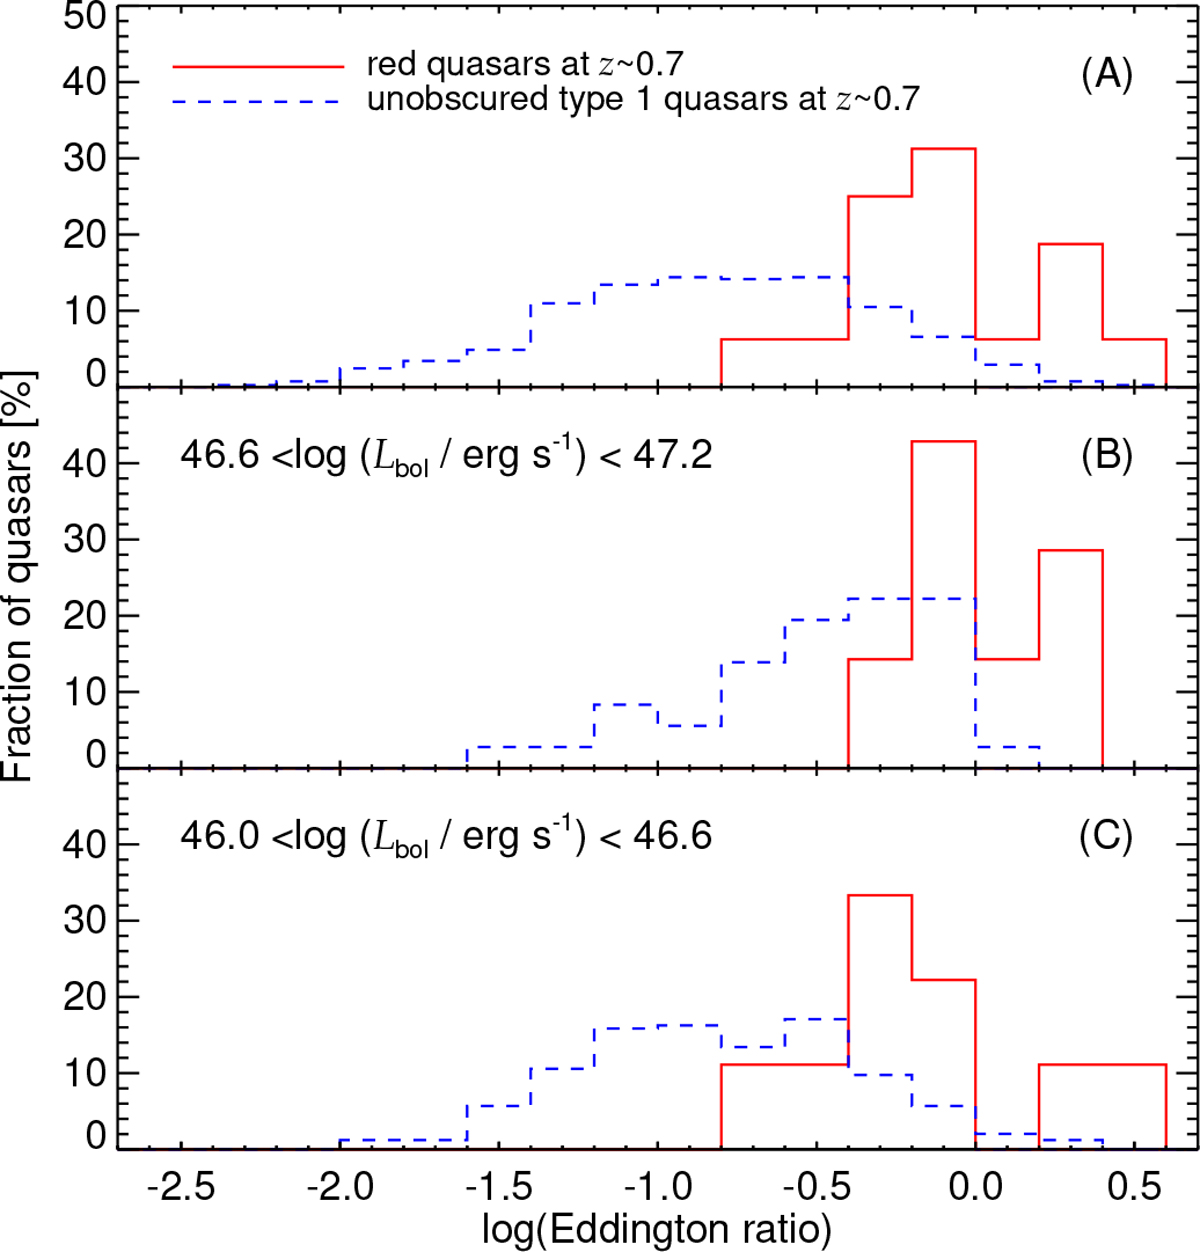
Panel A: eddington ratio distributions of red quasars and unobscured type 1 quasars at z ~ 0.7. The red solid and blue dashed histograms represent red quasars and unobscured type 1 quasars, respectively. The Eddington ratios of red quasars at z ~ 0.7 are adopted from Kim et al. (2015b). Panel B: eddington ratio distributions for high-luminous quasars (46.6 <log(Lbol∕erg s−1) < 47.2). Panel C: eddington ratio distributions for low-luminous quasars (46.0 < log(Lbol∕erg s−1) < 46.6).
Current usage metrics show cumulative count of Article Views (full-text article views including HTML views, PDF and ePub downloads, according to the available data) and Abstracts Views on Vision4Press platform.
Data correspond to usage on the plateform after 2015. The current usage metrics is available 48-96 hours after online publication and is updated daily on week days.
Initial download of the metrics may take a while.