Fig. 7
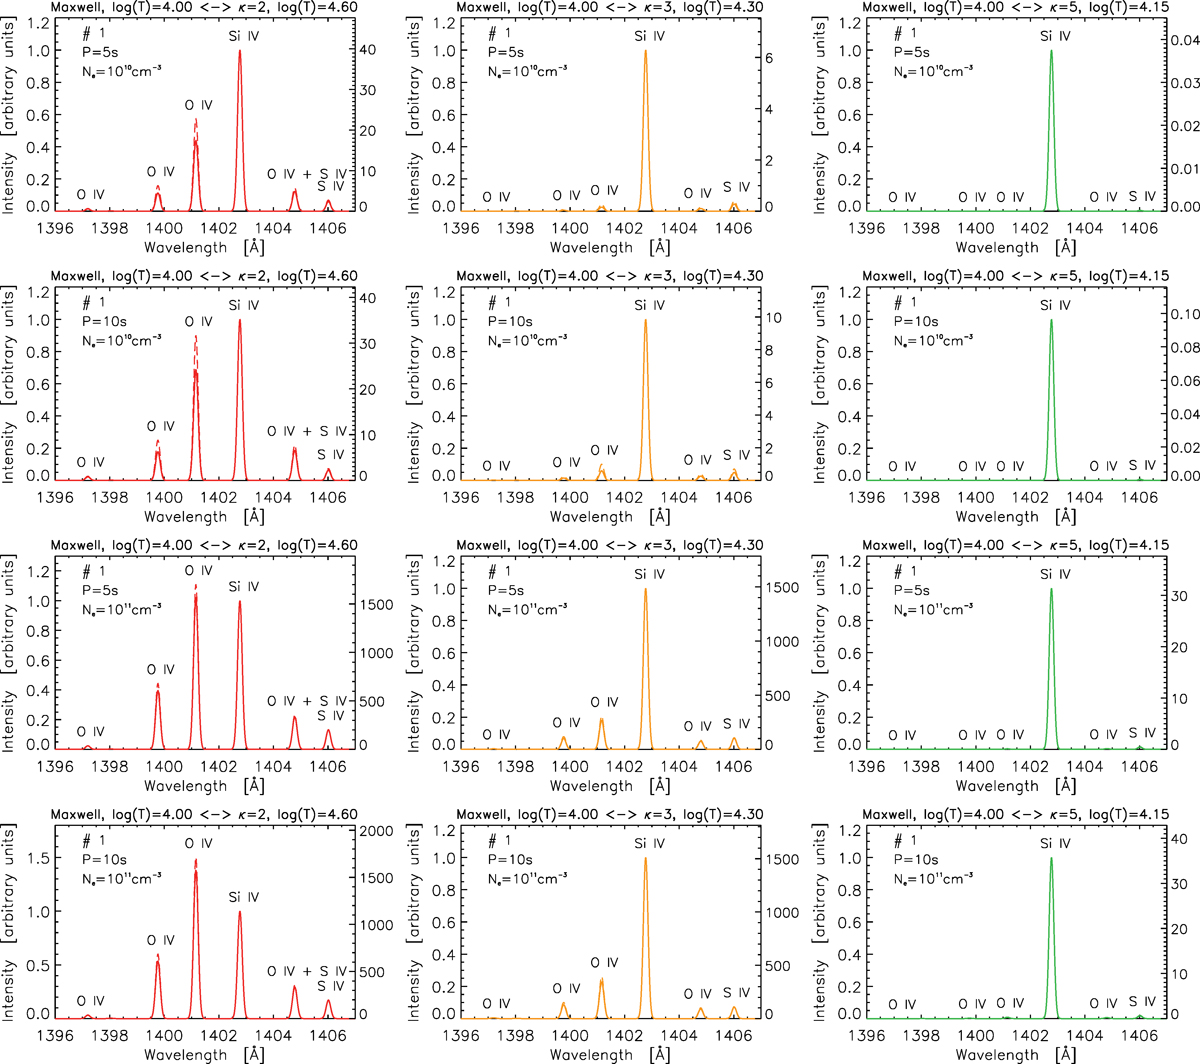
Synthetic TR spectra averaged over the first period, calculated for T = 104 K. The layout of this figure corresponds to Fig. 4. The parameters of each model are given in each panel. Red, orange, and green stand for a model with κ = 2, 3, and 5 during the second half-period, respectively. Full lines show the spectra with photoexcitation, while the dashed lines correspond to spectra without photoexcitation. Each spectrum is normalized with respect to the Si IV 1402.8 Å intensity. Original intensities (in arbitrary units) are shown in the right-hand side of each image.
Current usage metrics show cumulative count of Article Views (full-text article views including HTML views, PDF and ePub downloads, according to the available data) and Abstracts Views on Vision4Press platform.
Data correspond to usage on the plateform after 2015. The current usage metrics is available 48-96 hours after online publication and is updated daily on week days.
Initial download of the metrics may take a while.