Free Access
Fig. 2
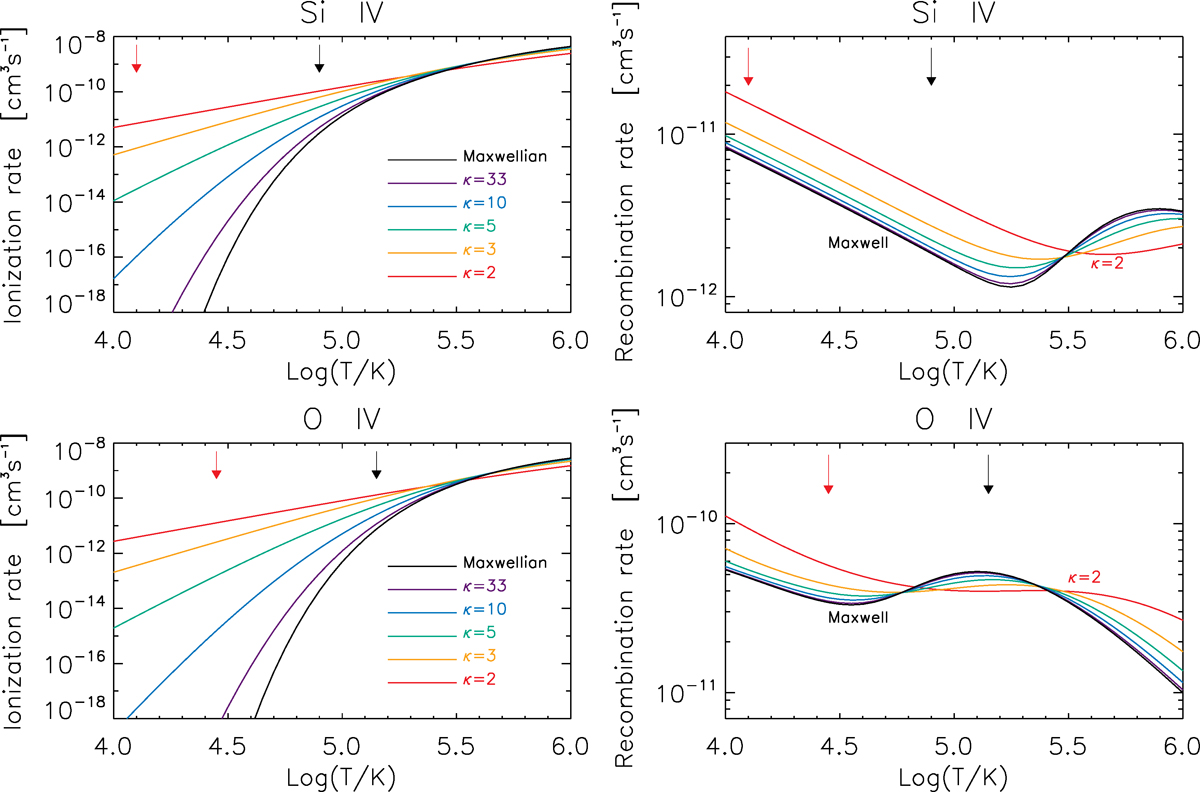
Ionization and recombination rates for Si IV (top) and O IV (bottom) for a Maxwellian and a κ-distribution with κ =2, 3, 5, 10, and 33. Colors denote individual κ values. Black and red arrows denote temperatures of the maximum relative ion abundance for the Maxwellian and κ-distribution with κ =2.
Current usage metrics show cumulative count of Article Views (full-text article views including HTML views, PDF and ePub downloads, according to the available data) and Abstracts Views on Vision4Press platform.
Data correspond to usage on the plateform after 2015. The current usage metrics is available 48-96 hours after online publication and is updated daily on week days.
Initial download of the metrics may take a while.