| Issue |
A&A
Volume 610, February 2018
|
|
|---|---|---|
| Article Number | A2 | |
| Number of page(s) | 7 | |
| Section | Numerical methods and codes | |
| DOI | https://doi.org/10.1051/0004-6361/201731713 | |
| Published online | 07 February 2018 | |
The Caviar software package for the astrometric reduction of Cassini ISS images: description and examples⋆,⋆⋆
1 Astronomy Unit, School of Physics and Astronomy, Queen Mary University of London, Mile End Road, London E1 4NS, UK
2 IMCCE, Observatoire de Paris, PSL Research Univ., UMR 8028 du CNRS, UPMC, Université de Lille 1, 77 av. Denfert-Rochereau, 75014 Paris, France
3 Department of Astronomy, Cornell University, Ithaca, NY 14853, USA
4 Department of Computer Science, Jinan University, 510632 Guangzhou, PR China
Received: 4 August 2017
Accepted: 13 October 2017
Aims. Caviar is a software package designed for the astrometric measurement of natural satellite positions in images taken using the Imaging Science Subsystem (ISS) of the Cassini spacecraft. Aspects of the structure, functionality, and use of the software are described, and examples are provided. The integrity of the software is demonstrated by generating new measurements of the positions of selected major satellites of Saturn, 2013–2016, along with their observed minus computed (O−C) residuals relative to published ephemerides.
Methods. Satellite positions were estimated by fitting a model to the imaged limbs of the target satellites. Corrections to the nominal spacecraft pointing were computed using background star positions based on the UCAC5 and Tycho2 star catalogues. UCAC5 is currently used in preference to Gaia-DR1 because of the availability of proper motion information in UCAC5.
Results. The Caviar package is available for free download. A total of 256 new astrometric observations of the Saturnian moons Mimas (44), Tethys (58), Dione (55), Rhea (33), Iapetus (63), and Hyperion (3) have been made, in addition to opportunistic detections of Pandora (20), Enceladus (4), Janus (2), and Helene (5), giving an overall total of 287 new detections. Mean observed-minus-computed residuals for the main moons relative to the JPL SAT375 ephemeris were − 0.66 ± 1.30 pixels in the line direction and 0.05 ± 1.47 pixels in the sample direction. Mean residuals relative to the IMCCE NOE-6-2015-MAIN-coorb2 ephemeris were −0.34 ± 0.91 pixels in the line direction and 0.15 ± 1.65 pixels in the sample direction. The reduced astrometric data are provided in the form of satellite positions for each image. The reference star positions are included in order to allow reprocessing at some later date using improved star catalogues, such as later releases of Gaia, without the need to re-estimate the imaged star positions.
Key words: astrometry / methods: data analysis / techniques: image processing / planets and satellites: general
The Caviar software is available for free download from: ftp://ftp.imcce.fr/pub/softwares/caviar.
Full Tables 1 and 5 are only available at the CDS via anonymous ftp to cdsarc.u-strasbg.fr (130.79.128.5) or via http://cdsarc.u-strasbg.fr/viz-bin/qcat?J/A+A/610/A2
© ESO, 2018
1. Introduction
The Caviar software was initially developed at Queen Mary University of London (QMUL) in 2003–4 as the Cassini spacecraft was approaching Saturn. Its development fulfilled an immediate need for a software package capable of performing astrometry of the Saturnian satellites using images recorded via the Cassini Imaging Science Subsystem (ISS). The software has since been used to generate approximately 5900 measurements of the positions of the Saturnian moons from Cassini ISS images (Murray et al. 2005; Cooper et al. 2008, 2014, 2015; Zhang et al. 2017), contributing a significant part of the astrometric dataset recently used to provide observational constraints on Saturn’s internal structure (Lainey et al. 2017). Cassini ISS astrometry of Saturn’s satellites has also been performed by Spitale et al. (2006) and Tajeddine et al. (2013, 2015) using different software, generating several thousands of observations.
Following an ongoing collaboration between the Cassini group at QMUL and the Institut de Mécanique Céleste et de Calcul des Éphémérides (IMCCE) of the Paris Observatory, Caviar has been extensively redesigned, incorporating a new graphical user interface (GUI) and a number of new options. This version of the software is now available to the community for general use, and in this paper we provide a broad outline of the features and capabilities of the new software, illustrated with examples. This paper is not intended to be a complete guide to using Caviar. For detailed parameter descriptions and instructions for use, we refer the reader to the user guide bundled with the software.
Caviar is written using the IDL language (Harris Geospatial Solutions). The computational capabilities of Caviar also rely heavily on the SPICE software toolkit (Acton 1996) as well as internal IDL routines and a number of other external IDL libraries (see Sect. 3).
In addition to describing Caviar, in this paper we provide a total of 256 new astrometric measurements of the positions of five of the main moons of Saturn, reduced using the new version of the software. Observed-minus-computed residuals are provided relative to the latest ephemerides from JPL and IMCCE.
Throughout this paper, we use the Cassini ISS convention of referring to the image pixel coordinate along the x-axis as “sample” and the y-coordinate as “line”. For a detailed description of the Cassini ISS, see Porco et el. (2004).
2. Obtaining Caviar
The Caviar software is available for free download under the terms of a Creative Commons Attribution-NonCommercial-ShareAlike 4.0 International License1.
The software only, without SPICE kernels is available at the IMCCE website2.
At the time of writing, the Cassini mission is still in progress and mission-specific SPICE kernels typically cover relatively short time segments, requiring a large number of kernels to span the entire mission to date. For convenience, a complete set of SPICE kernels covering the Cassini tour from 2000 to 2016 has also been assembled to avoid the need to download them individually. It is anticipated that, following the end of the Cassini mission in late 2017, reconstructed and concatenated kernels will be made available, reducing the number of kernels required to cover the entire mission. New or updated kernels may easily be added as they become available, as described in the Caviar user guide.
A complete set of Cassini mission specific kernels (up to 2016) has been assembled for use with Caviar and is also available from the IMCCE website3.
It should be noted that this file is approximately 6.3 Gb in size.
3. Requirements for running Caviar
Caviar has so far been tested on Mac OS X and Linux. The following requirements are necessary in order to run Caviar:
-
A full license for IDL.
-
An active internet connection to allow access to star catalogues via the Vizier web server.
-
The IDL version of the SPICE toolkit4.
-
SPICE kernels: Caviar accesses spacecraft instrument information, ephemerides, and other information relating to planetary bodies from SPICE kernels. At the time of writing, several hundred different kernels are needed to cover the Cassini tour. To simplify installation, a complete set of the kernels has been assembled for use with Caviar (see Sect. 2). Alternatively, kernels may also be obtained from the NAIF website5.
-
The CDSCLIENT package, used to access reference star information via the Vizier web server6.
-
The “wget” command must also be available, if not already installed.
Full instructions for the installation of Caviar are provided with the code.
4. Caviar graphical interface
The Caviar GUI is designed to fit on the device desktop and will automatically resize, with scroll-bars where necessary, depending on the size of the screen. The main GUI consists of a single unit, showing the image on the left and the toolkit options on the right (Fig. 1). When the cursor is inside the image frame, a small zoom window appears at the bottom right of the interface. Clicking the REFRESH button removes the small zoom window to reveal the toolkit options underneath. The main image can also be zoomed by selecting a factor from a drop-down menu at the top right.
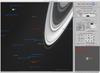 |
Fig. 1 Main Caviar graphical interface, showing part of an image from the Cassini wide-angle camera (W1559467979_1.IMG). In this example, the main image has been zoomed by a factor of two (the zoom factor is user-selected). Predicted positions of any known satellites or planets within the field of view, based on SPICE ephemerides, are shown in yellow. Predicted catalogue star positions are shown in red and blue: stars labelled in red were successfully detected within the image, while those in blue, although within the field of view, were not detectable. When the cursor is within the main image window, the small zoom panel at the lower right follows the cursor position. The position of the cursor is labelled in real time, showing image coordinates, in addition to right ascension (RA) and declination (Dec), and radial distance from the centre of the primary body (Saturn in this case). This small zoom window disappears when the refresh button is pressed (second button from top right) to reveal the additional tool buttons hidden underneath. |
In addition to displaying Cassini images with the positions of stars and solar system bodies labelled, Caviar is currently designed to perform two basic functions: correcting the camera pointing direction and measuring satellite positions.
5. Camera pointing correction
Caviar uses the fixed camera distortion model of Owen (2003) to map from right ascension and declination to image pixel coordinates, based on the supplied camera pointing information.
The nominal camera pointing direction for a given image is based on information from the spacecraft star trackers at the time the image was taken, and is encapsulated in SPICE C-kernels (files with suffix. bc). For high-precision astrometry, Caviar provides the means to correct this approximate pointing direction using the most up-to-date reference star catalogues. Before correction, the nominal pointing error is typically of the order of 10 pixels, while after correction, an accuracy of 0.1 pixel can be usually be achieved with good reference star coverage. In the current version of Caviar, the UCAC5 (Zacharias et al. 2017) and Tycho2 (Høg et al. 2000) catalogues have been selected in preference to Gaia-DR1 (Lindegren et al. 2016) because of the lack of proper motion information in the first release of the Gaia catalogue. However, the code can easily be modified by the user to access any desired catalogue by making the appropriate changes to the parameters in the Vizquery command inside the Caviar code. This is recommended as soon as the next release of the Gaia catalogue becomes available in 2018.
The pointing correction involves firstly the detection of star-like objects in the image, using the DAOPHOT Find algorithm (Stetson 1987). The positions of these imaged objects are then matched to nearby reference stars from the star catalogues. It may be necessary to perform an approximate alignment of the reference star field with the imaged stars, before matching, if the offset is more than a few pixels. This can be done by dragging the reference star field across the image, using either a mouse or the arrow buttons provided within the GUI. Following the approximate alignment of reference stars and imaged stars, the reference star positions may be iteratively fitted to the imaged stars, minimising the observed-minus-computed residuals. The updated camera pointing information can then be saved to an output file which can also be loaded back into Caviar during a later session to avoid the need to re-estimate the pointing correction.
Examples
The number of detectable reference stars in a given image depends on the observation design parameters such as exposure length and on the catalogue star coverage for the particular patch of sky represented by the image. It has a direct bearing on the accuracy of the derived pointing correction. For example, Tajeddine et al. (2013) demonstrated how the computed camera twist angle converged to the expected value as the number of stars used in the estimation of the camera pointing correction was increased.
While images designed specifically for astrometry use exposure length values selected to provide optimum exposure of background stars, images designed, for example, for the study of moon surface features will often be underexposed for background star detection. Although the default parameters are generally satisfactory for most images, it may be possible to improve the detection of faint stars by modifying the star detection parameters in Caviar via the GUI. For example, for the image shown in Fig. 4, by modifying the FIND parameters Caviar is able to detect four stars, compared to only one star using the default values.
Regarding catalogue star coverage, in Fig. 2 we show an example of the better coverage available in the Gaia-DR1 catalogue compared to that in Tycho2 and UCAC5. In this particular image there are no catalogue stars of magnitude less than 12 within the field of view using the Tycho2 or UCAC5 catalogues, while Gaia-DR1 has three. All of the catalogues have several stars of magnitude between 12 and 13, but they are not detectable. So although, as mentioned above, we have opted not to use Gaia-DR1 in the first release of Caviar because of the lack of proper motion information, this example indicates the potential benefits of the future full release of Gaia. The exposure length might still be an issue, however, and in fact no stars of any magnitude were actually detectable in this image, due to the short (70 ms) exposure duration, and consequently the pointing correction could not be performed (this image is not included in the reduced dataset).
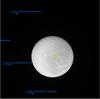 |
Fig. 2 Image showing the potential improvement in star coverage using the Gaia DR-1 catalogue. Stars of magnitude less than 12 from the Gaia-DR1 catalogue are superimposed on the image. There are no Tycho2 or UCAC5 catalogue stars of magnitude less than 12 in this image (N1843673269_1.IMG). |
For images with no catalogue star coverage, or images with star coverage but no detectable stars, perhaps due to the choice of exposure length, it may still be possible to correct the camera pointing direction using other reference features in the image. Caviar allows circular rings of arbitrary radius, centred on the planet, to be projected onto the image. A published model of Saturn’s F ring (Cooper et al. 2013) can also be superimposed. The ring template can then be manually moved using the mouse buttons until it aligns with the imaged rings, allowing an approximate pointing correction to be performed without the use of reference stars. The new pointing direction based on this manual alignment may then be saved. The actual statistical fitting of the ring model to the image is planned for future releases. We show an example of this in Fig. 3, using an image of the main rings of Saturn, including the satellite Pan embedded in the Encke Gap. Models of the A ring edge and the F ring have been manually aligned with their corresponding imaged positions. Rings corresponding to other known radial features can easily be added by the user from a drop-down menu in order to constrain the alignment further.
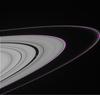 |
Fig. 3 Ring features used as reference markers for the estimation of the camera pointing correction (image N1716498202_1.IMG). |
6. Measurement of satellite positions
6.1. Centroid measurement
For cases where the satellite of interest is not fully resolved in the image, a centroiding option is provided, allowing the position of the centre of light of the satellite to be estimated using essentially the same approach as that used to find star positions described in Sect. 5. This option requires a pre-existing ephemeris for the satellite, so that the position of its centre is approximately known. Having estimated the centre of light, an adjustment is then made to find the centre of figure based on the phase angle (camera-target-Sun angle) at the time of the observation.
6.2. Limb fitting
For satellites that are fully resolved in the image, a limb fitting approach is used to find the centre of figure of the satellite. In addition to a pre-existing ephemeris for the satellite that gives the approximate position of its centre, this option also requires a model of the shape of the limb of the satellite. Currently, the shape model must be in the form of a SPICE ellipsoid. Caviar projects the SPICE ellipsoid onto the image, based on the camera pointing information, displaying it as a colour overlay.
The actual imaged-position of the limb of the satellite is first estimated using either of two options: a gradient-based edge detection method, or the Canny edge detection algorithm (Canny 1986). The ellipsoidal shape model from SPICE is then iteratively fitted to the measured limb position. The estimated astrometric position of the centre of figure of the satellite then corresponds to the centre of the fitted shape model.
6.3. Examples
Caviar searches for the actual limb within the image within a user-defined threshold around the position represented by the projected limb model. This method has proven to be robust, given that the shapes of most satellites are well approximated by a projected ellipsoid model, even in the presence of irregular surface features such as heavy cratering or equatorial ridges. However, there is a trade-off in terms of the level of distortion that can be tolerated in the limb fitting, although adverse effects can be mitigated to a certain extent by the choice of parameters selected via the GUI. While higher resolution images can, in general, be expected to lead to an increase in the precision of the measured centre of figure of a satellite, this can be partly offset by the corresponding improvement in the definition of irregular surface features that are not reproduced by the ellipsoidal limb model.
To illustrate this we show in Fig. 4 an image of Tethys (N_1809893546_1.IMG), where the orientation of the image is such that the large crater, Odysseus, distorts the limb edge. Figure 5 shows a magnified version of the area enclosed by the white box at the lower left in Fig. 4. In this region, the limb is adequately approximated by the projected ellipsoidal model and as a result, the detected limb, shown in magenta, closely follows the model, shown in cyan. Conversely, in Fig. 6, which shows a magnified version of the area enclosed by the white box at the upper right in Fig. 4, the distorting effect of the crater rim on the limb edge is clear, causing the detected limb to depart significantly from the position of the limb model.
The extent to which this influences the accuracy of the centre-of-figure measurement clearly depends on the level of irregularity of the limb in the image as whole. In this particular case, the limb is sufficiently well-behaved in terms of satisfying the ellipsoidal model over the bulk of the image for the effects of the localised distortion at the crater edges to be diluted. Interestingly, the O−C residuals for this image were − 0.41 in line and 2.578 in sample relative to the JPL SAT375 ephemeris, suggesting a possible bias in the sample direction that could be due to the limb-distortion. However, the residuals relative to the NOE-6-2015-MAIN-Coorb2 ephemeris were − 0.52 and − 2.017 in line and sample, respectively, with a sample offset in the opposite direction. So the effects of the cratering distortion in this particular case do not seem to be significant, and the observed offset in the sample direction seems to be due to a difference between the two reference ephemerides.
This example also illustrates how the use of a digital terrain model that properly takes into account irregular surface features would be able to improve the effectiveness of limb modelling and fitting for images with particularly irregular shapes or significant surface distortion due to cratering. This capability is under development for a future release of Caviar (Sect. 9).
For further discussion and examples of the limb fitting technique, including the origin of potential biases, see Cooper et al. (2014).
7. New observations
To illustrate the use of Caviar, we include a total of 256 new astrometric positions of five of the main moons of Saturn, Mimas (44), Tethys (58), Dione (55), Rhea (33), Iapetus (63), and Hyperion (3), for the period 2013 August 30 to 2016 June 04. While there is a high volume of data covering this period, we selected and reduced only the highest resolution images where the moons appeared large in size. As a consequence, these new data will provide the tightest constraints on the orbits compared to other ISS data of the same period.
The raw images were obtained from the PDS Imaging Atlas7 by searching the database for the chosen satellites, selecting only images taken using clear filters (CL1 and CL2). We excluded Enceladus from the list of chosen targets because of existing published Cassini astrometry for the period 2004 to 2011 (Tajeddine et al. 2013, 2015), as well as planned astrometry from more recent images (Zhang et al. 2017). However, four of the images for the selected targets also included Enceladus, so we include these detections here. Opportunistic sightings of Pandora (20), Janus (2), and Helene (5) are also included in this work. We excluded Titan because the thick atmosphere presents special challenges for astrometric measurement based on limb fitting which are beyond the scope of this current work. This will be the subject of future investigation.
The measured position of each satellite is provided in digital form as a table of values, listing observation time, measured line and sample, equivalent right ascension and declination, and measured pointing information. Table 1 shows a small section of the online table by way of example. The full table is available electronically from the CDS. Computed star positions (Table 5) are only available electronically at the CDS.
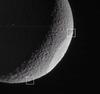 |
Fig. 4 Fully resolved image of Tethys with its main crater, Odysseus, at one edge. The original image has been zoomed by a factor of two and cropped. The area enclosed by the white box at the lower left is magnified in Fig. 5, while the corresponding box at the upper right, on the upper edge of the crater, is shown in Fig. 6 (image N1809893546_1.IMG). |
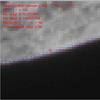 |
Fig. 5 Zoom of the area enclosed by the white box at the lower left in Fig. 4, showing how the detected limb (magenta) closely follows the projected ellipsoidal model (cyan). |
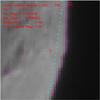 |
Fig. 6 Zoom of the area enclosed by the white box at the upper right in Fig. 4, showing how the measured limb (magenta) departs from the ellipsoidal model (cyan) due to the distorting effect of the crater rim. |
Sample of Cassini ISS observations
8. Observed minus computed residuals
For comparison, observed minus computed (O−C) residuals were computed relative to the current JPL ephemeris, SAT375, and latest IMCCE ephemeris, NOE-6-2015-MAIN-Coorb2. The SAT375 ephemeris represents a fit to Earth-based, HST, Pioneer, Voyager, and Cassini observations for the eight main moons of Saturn, plus Phoebe and the co-orbitals Telesto, Calypso, Helene, and Polydeuces, using data up to 2015 FEB 02. The NOE-6-2015-MAIN-Coorb2 includes the same bodies except Phoebe. It should be kept in mind for the discussion which follows that neither of these two reference ephemerides used the new observations included in this paper. So the observed-minus-computed residuals shown here are “pre-fit residuals”.
Line and sample residuals for each individual satellite are plotted as a function of time relative to the SAT375 ephemeris in Fig. 7 and as line versus sample in Fig. 8. For direct comparison with Fig. 8, the corresponding line versus sample residuals using NOE-6-2015-MAIN-Coorb2 are shown in Fig. 9.
Mean residuals with standard deviations are listed in Tables 2 and 3 for SAT375 and NOE-6-2015-MAIN-Coorb2 respectively, while Table 4 separately lists mean and standard deviations for Janus and Pandora relative to the SAT393 ephemeris.
Comparing Figs. 8 and 9, together with the values given in Tables 2 and 3, the residuals are generally well-behaved relative to both reference ephemerides, although they show a significant offset for Mimas and Iapetus.
The residuals for Mimas are consistently smaller relative to the NOE-6-2015-MAIN-Coorb2 compared to the SAT375, suggesting a systematic difference in the two ephemerides for this satellite.
Mean values of O−C residuals in pixels relative to the JPL SAT375 ephemeris.
Mean values of O−C residuals in pixels relative to the IMCCE NOE–6-2015-MAIN-Coorb2 ephemeris.
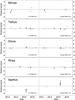 |
Fig. 7 O−C residuals relative to the JPL SAT375 ephemeris plotted as a function of time. Units are NAC pixels. Enceladus, Hyperion and Helene are not shown, due to the small number of observations for these satellites, but are included in Tables 2 and 3. Two outliers for Mimas (− 5.3, − 14.7) and (− 8.6, − 10.9) and one for Iapetus (− 5.9, 4.3) are not shown. |
For Iapetus, the residuals show an offset relative to both ephemerides. We note that the typical resolution for the images of Iapetus is ~6 km/px, so that in units of km, the mean values of the residuals in the line and sample directions are approximately (− 13, 8) and (− 8, 10). Iapetus has a mean radius of ~735 km. The solar phase angle (observer-target-offset) for these images was generally in the range 40 to 60 degrees, which is advantageous for limb fitting purposes since the extent of the solar illumination of the limb increases with decreasing phase angle. However, Iapetus is notable both for its variable brightness and for a prominent equatorial ridge reaching an elevation of ~13 km. We therefore believe that the most likely explanation for the observed offset in the residuals is a bias in the limb detection caused by the equatorial ridge: the orientation of Iapetus in the images is such that the brightest part of the limb also coincides with its intersection with the equatorial plane, i.e. with the location of the ridge. The limb detection algorithm therefore preferentially locks on to this bright and anomalous feature and generates a bias in the positive sample and negative line direction. This is consistent with the orientation of the observed offset in the residuals. An obvious solution to this is to use a more accurate digital terrain model which includes the equatorial ridge.
For a more general discussion of other potential sources of bias in the limb fitting process itself, the reader is referred to Cooper et al. (2014).
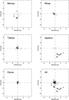 |
Fig. 8 O−C residuals relative to the JPL SAT375 ephemeris plotted as line residual versus sample residual. Units are NAC pixels. Enceladus, Hyperion, and Helene are not shown, due to the small number of observations for these satellites, but are included in Tables 2 and 3. Two outliers for Mimas (− 5.3, − 14.7) and (− 8.6, − 10.9) and one for Iapetus (− 5.9, 4.3) are not shown. |
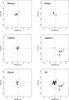 |
Fig. 9 O−C residuals relative to the IMCCE NOE-6-2015-MAIN-Coorb2 ephemeris plotted as line residual versus sample residual. Units are NAC pixels. Enceladus, Hyperion, and Helene are not shown, due to the small number of observations for these satellites, but are included in Tables 2 and 3. One outlier for Mimas (0.2, − 5.6), one for Dione (− 1.0, 5.3), and one for Iapetus (− 5.1, 3.4) are not shown. |
9. Summary and future work
The Caviar software in its original form has a proven track record in generating thousands of high-precision astrometric observations of the Saturnian moons using Cassini ISS images. The software is now available for general release in the form of the new and updated version described and demonstrated in this paper, incorporating a complete restructuring of the code and a new graphical user interface.
The structure of the code lends itself relatively easily to further modification within the framework of the IDL language and the version described in this paper provides a useful basis for the addition of a variety of new options.
Planned options for future releases of Caviar include
-
The reduction of images from other spacecraft, including Viking, Mariner 9, Voyager, Galileo, and New Horizons.
-
The option to import digital terrain models for satellite limbs as an alternative to the ellipsoidal models used by the current version.
-
The use of the next release of the Gaia star catalogue.
-
Options for batch processing of large volumes of images.
Mean values of O−C residuals in pixels relative to the JPL SAT393 ephemeris.
Acknowledgments
N.J.C. is grateful to the Paris Observatory for funding as an invited researcher at the IMCCE. We thank the FP7-ESPaCE European program for funding under the agreement No. 263466. N.J.C. and C.D.M. thank the Science and Technology Facilities Council (Grant No. ST/P000622/1) for financial support. This work was also supported by the International Space Science Institute (ISSI). The authors thank their colleagues in the Encelade working group at the IMCCE of the Paris Observatory (http://www.issibern.ch/teams/saturnastrometry/?page%20id=21), and the members and associates of the Cassini ISS team. We are heavily indebted to the authors of the SPICE software toolkit, without whom the development of Caviar would have been a considerably more difficult task.
References
- Acton, C. H. 1996, Planet. Space Sci., 44, 65 [NASA ADS] [CrossRef] [Google Scholar]
- Canny, J. 1986, IEEE Trans. Pattern Analysis and Machine Intelligence, 8, 679 [CrossRef] [Google Scholar]
- Cooper, N. J., Murray, C. D., Evans, M. W., et al. 2008, Icarus, 195, 765 [NASA ADS] [CrossRef] [Google Scholar]
- Cooper, N. J., Murray, C. D., & Williams, G. A. 2013, AJ, 145, 161 [NASA ADS] [CrossRef] [Google Scholar]
- Cooper, N. J., Murray, C. D., Lainey, V., et al. 2014, A&A, 572, A43 [NASA ADS] [CrossRef] [EDP Sciences] [Google Scholar]
- Cooper, N. J., Renner, S., Murray, C. D., & Evans, M. W. 2015, AJ, 149, 1 [NASA ADS] [Google Scholar]
- Høg, E., Fabricius, C., Makarov, V. V., et al. 2000, A&A, 355, L27 [NASA ADS] [Google Scholar]
- Lainey, V., Jacobson, R. A., Tajeddine, R., et al. 2017, Icarus, 281, 286 [NASA ADS] [CrossRef] [Google Scholar]
- Lindegren, L., and 83 coauthors, 2016, A&A, 595, A1 [NASA ADS] [CrossRef] [EDP Sciences] [Google Scholar]
- Murray, C. D., Cooper, N. J., Evans, M. W., & Beurle, K., Icarus, 179, 222 [Google Scholar]
- Owen, W. M. Jr. 2003, JPL IOM 312.E-2003-001 [Google Scholar]
- Porco, C. C., West, R. A., Squyres, S., et al. 2004, Space Sci. Rev., 115, 363 [NASA ADS] [CrossRef] [Google Scholar]
- Spitale, J. N., Jacobson, R. A., Porco, C. C., & Owen, W. M. 2006 AJ, 132, 692 [NASA ADS] [CrossRef] [Google Scholar]
- Stetson, P. B. 1987, PASP, 99, 191 [NASA ADS] [CrossRef] [Google Scholar]
- Tajeddine, R., Cooper, N. J., Lainey, V., Charnoz, S., & Murray, C. D. 2013, A&A, 551, A129 [NASA ADS] [CrossRef] [EDP Sciences] [Google Scholar]
- Tajeddine, R., Lainey, V., Cooper, N. J., Murray, C. D. 2015, A&A, 575, A73 [NASA ADS] [CrossRef] [EDP Sciences] [Google Scholar]
- Zacharias, N., Finch, C., Frouard, J., 2017, AJ, 153, 3043 [Google Scholar]
- Zhang, Q.-F., Lainey, V., Vienne, A., et al. 2017, Proc. IAU Symp. 330 [Google Scholar]
All Tables
Mean values of O−C residuals in pixels relative to the IMCCE NOE–6-2015-MAIN-Coorb2 ephemeris.
All Figures
|
Fig. 1 Main Caviar graphical interface, showing part of an image from the Cassini wide-angle camera (W1559467979_1.IMG). In this example, the main image has been zoomed by a factor of two (the zoom factor is user-selected). Predicted positions of any known satellites or planets within the field of view, based on SPICE ephemerides, are shown in yellow. Predicted catalogue star positions are shown in red and blue: stars labelled in red were successfully detected within the image, while those in blue, although within the field of view, were not detectable. When the cursor is within the main image window, the small zoom panel at the lower right follows the cursor position. The position of the cursor is labelled in real time, showing image coordinates, in addition to right ascension (RA) and declination (Dec), and radial distance from the centre of the primary body (Saturn in this case). This small zoom window disappears when the refresh button is pressed (second button from top right) to reveal the additional tool buttons hidden underneath. |
| In the text | |
|
Fig. 2 Image showing the potential improvement in star coverage using the Gaia DR-1 catalogue. Stars of magnitude less than 12 from the Gaia-DR1 catalogue are superimposed on the image. There are no Tycho2 or UCAC5 catalogue stars of magnitude less than 12 in this image (N1843673269_1.IMG). |
| In the text | |
|
Fig. 3 Ring features used as reference markers for the estimation of the camera pointing correction (image N1716498202_1.IMG). |
| In the text | |
|
Fig. 4 Fully resolved image of Tethys with its main crater, Odysseus, at one edge. The original image has been zoomed by a factor of two and cropped. The area enclosed by the white box at the lower left is magnified in Fig. 5, while the corresponding box at the upper right, on the upper edge of the crater, is shown in Fig. 6 (image N1809893546_1.IMG). |
| In the text | |
|
Fig. 5 Zoom of the area enclosed by the white box at the lower left in Fig. 4, showing how the detected limb (magenta) closely follows the projected ellipsoidal model (cyan). |
| In the text | |
|
Fig. 6 Zoom of the area enclosed by the white box at the upper right in Fig. 4, showing how the measured limb (magenta) departs from the ellipsoidal model (cyan) due to the distorting effect of the crater rim. |
| In the text | |
|
Fig. 7 O−C residuals relative to the JPL SAT375 ephemeris plotted as a function of time. Units are NAC pixels. Enceladus, Hyperion and Helene are not shown, due to the small number of observations for these satellites, but are included in Tables 2 and 3. Two outliers for Mimas (− 5.3, − 14.7) and (− 8.6, − 10.9) and one for Iapetus (− 5.9, 4.3) are not shown. |
| In the text | |
|
Fig. 8 O−C residuals relative to the JPL SAT375 ephemeris plotted as line residual versus sample residual. Units are NAC pixels. Enceladus, Hyperion, and Helene are not shown, due to the small number of observations for these satellites, but are included in Tables 2 and 3. Two outliers for Mimas (− 5.3, − 14.7) and (− 8.6, − 10.9) and one for Iapetus (− 5.9, 4.3) are not shown. |
| In the text | |
|
Fig. 9 O−C residuals relative to the IMCCE NOE-6-2015-MAIN-Coorb2 ephemeris plotted as line residual versus sample residual. Units are NAC pixels. Enceladus, Hyperion, and Helene are not shown, due to the small number of observations for these satellites, but are included in Tables 2 and 3. One outlier for Mimas (0.2, − 5.6), one for Dione (− 1.0, 5.3), and one for Iapetus (− 5.1, 3.4) are not shown. |
| In the text | |
Current usage metrics show cumulative count of Article Views (full-text article views including HTML views, PDF and ePub downloads, according to the available data) and Abstracts Views on Vision4Press platform.
Data correspond to usage on the plateform after 2015. The current usage metrics is available 48-96 hours after online publication and is updated daily on week days.
Initial download of the metrics may take a while.