Fig. 8
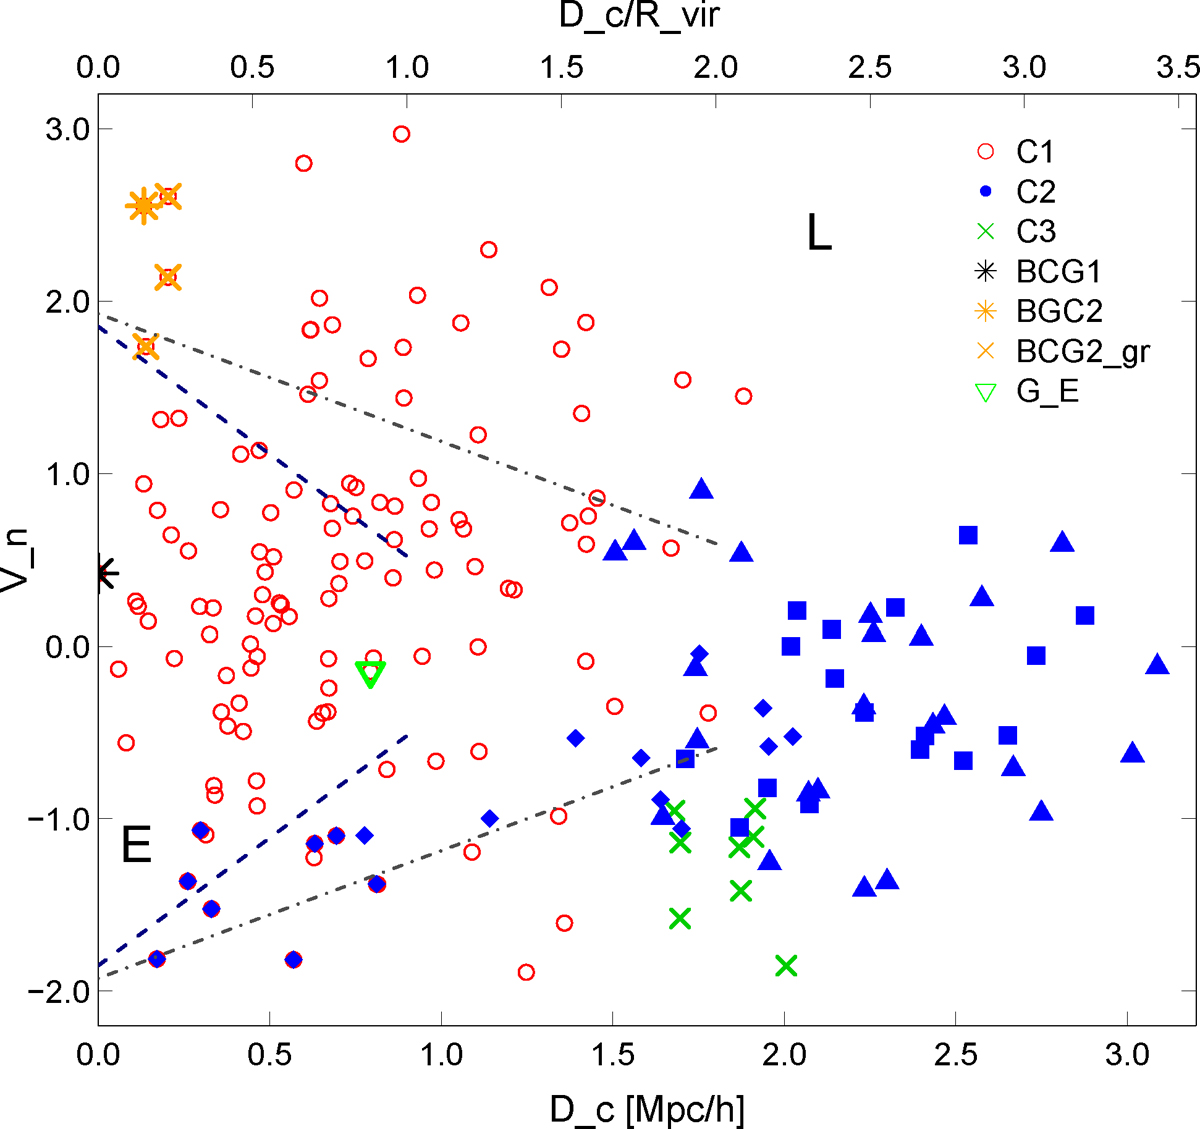
Normalised velocity of galaxies with respect to the cluster mean velocity vs. projected clustercentric distance for the cluster A2142, its outskirts subclusters, and infalling groups (see text). Lines separate approximately the early and late infall galaxies with increasing time of infall; two different boundaries separate early and late infall time galaxies. The earliest infall galaxies with infall time tinf > 1 Gyr lie between the black dashed lines, calculated using Rvir, and late or ongoing infall galaxies with infall time tinf < 1 Gyr lie above and below the lines, and on the right side of the lines (see Oman et al. 2013; Agulli et al. 2017, for details). The grey dash-dotted lines are calculated using Rmax (see text). Notations of components C1–C3 and M1–M3 are the same as in Fig. 4. Notations of the BCGs and possible infalling groups are given in legend; E indicates the early infall region and L denotes the late infall region.
Current usage metrics show cumulative count of Article Views (full-text article views including HTML views, PDF and ePub downloads, according to the available data) and Abstracts Views on Vision4Press platform.
Data correspond to usage on the plateform after 2015. The current usage metrics is available 48-96 hours after online publication and is updated daily on week days.
Initial download of the metrics may take a while.