Fig. 7
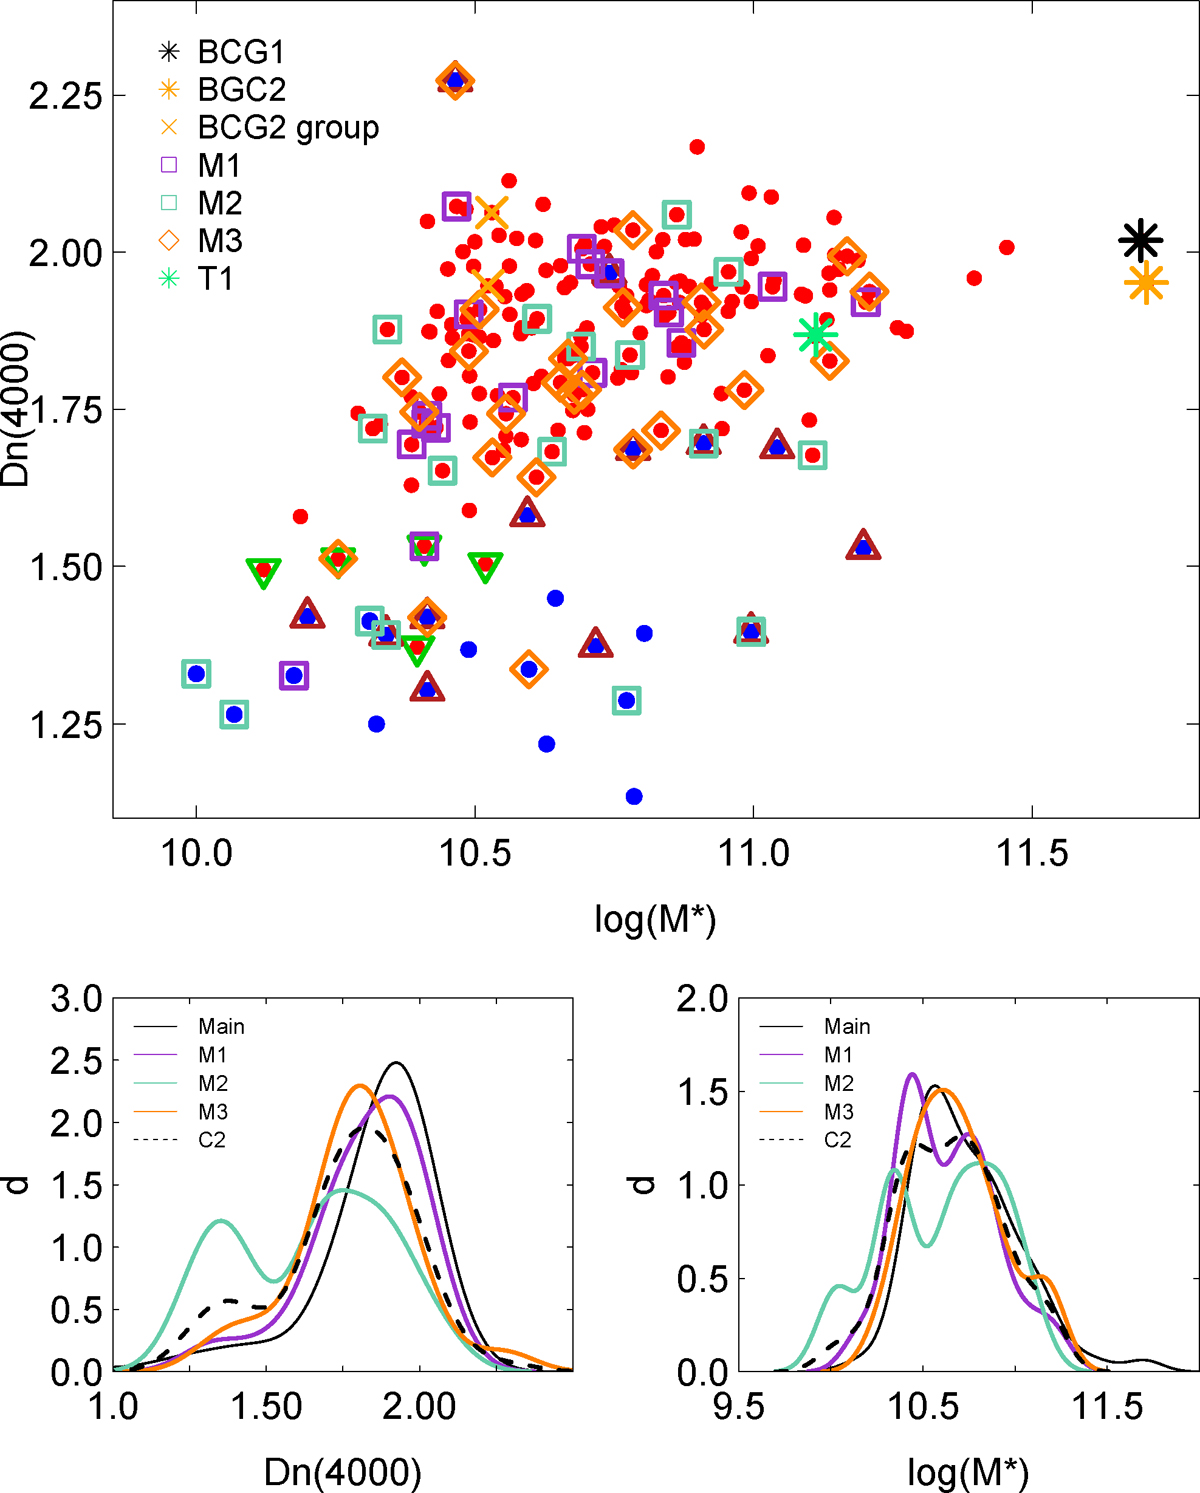
Upper panel: Dn(4000) index vs. stellar mass for the cluster A2142. Red circles indicate low star formation rate galaxies with log SFR < −0.5, and blue circles shows high star formation rate galaxies with log SFR ≥ −0.5. Other notations are as in Fig. 5. Lower panels: probability density distributions of Dn (4000) (left), and stellar mass (right) of galaxies in the main cluster (black solid line), in the outskirts component C2 (subclusters M1–M3 taken together, black dashed line), and in subclusters M1–M3 (M1 – violet line, M2 – aquamarine line, and M3 – orange line).
Current usage metrics show cumulative count of Article Views (full-text article views including HTML views, PDF and ePub downloads, according to the available data) and Abstracts Views on Vision4Press platform.
Data correspond to usage on the plateform after 2015. The current usage metrics is available 48-96 hours after online publication and is updated daily on week days.
Initial download of the metrics may take a while.