Fig. 6
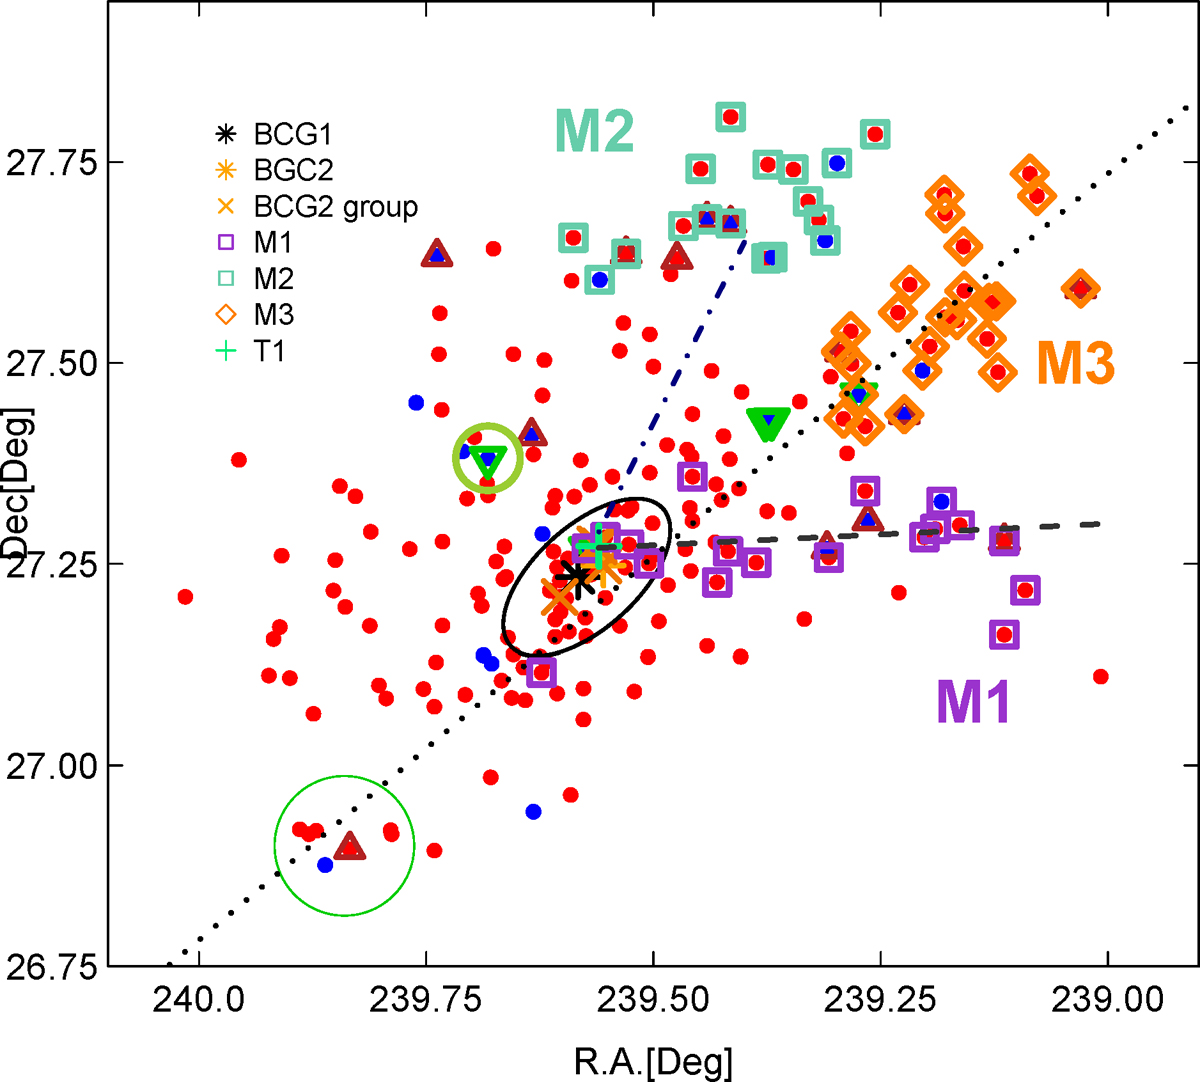
Distribution of galaxies in the cluster A2142 and its outskirts in the sky plane. The symbols are the same as in Fig. 5. The lines show the direction of supercluster axis (dotted line), subcluster M1 axis (dashed line, this direction coincides with the direction of radio tail of the galaxy T1, see text), and subcluster M2 direction (dash-dotted line, coincides with the direction of radio tail of the galaxy T2). The ellipse shows approximately the contour of the X-ray halo of the cluster and radio emission at 1.38 GHz (see Venturi et al. 2017, for details).
Current usage metrics show cumulative count of Article Views (full-text article views including HTML views, PDF and ePub downloads, according to the available data) and Abstracts Views on Vision4Press platform.
Data correspond to usage on the plateform after 2015. The current usage metrics is available 48-96 hours after online publication and is updated daily on week days.
Initial download of the metrics may take a while.