Fig. 5
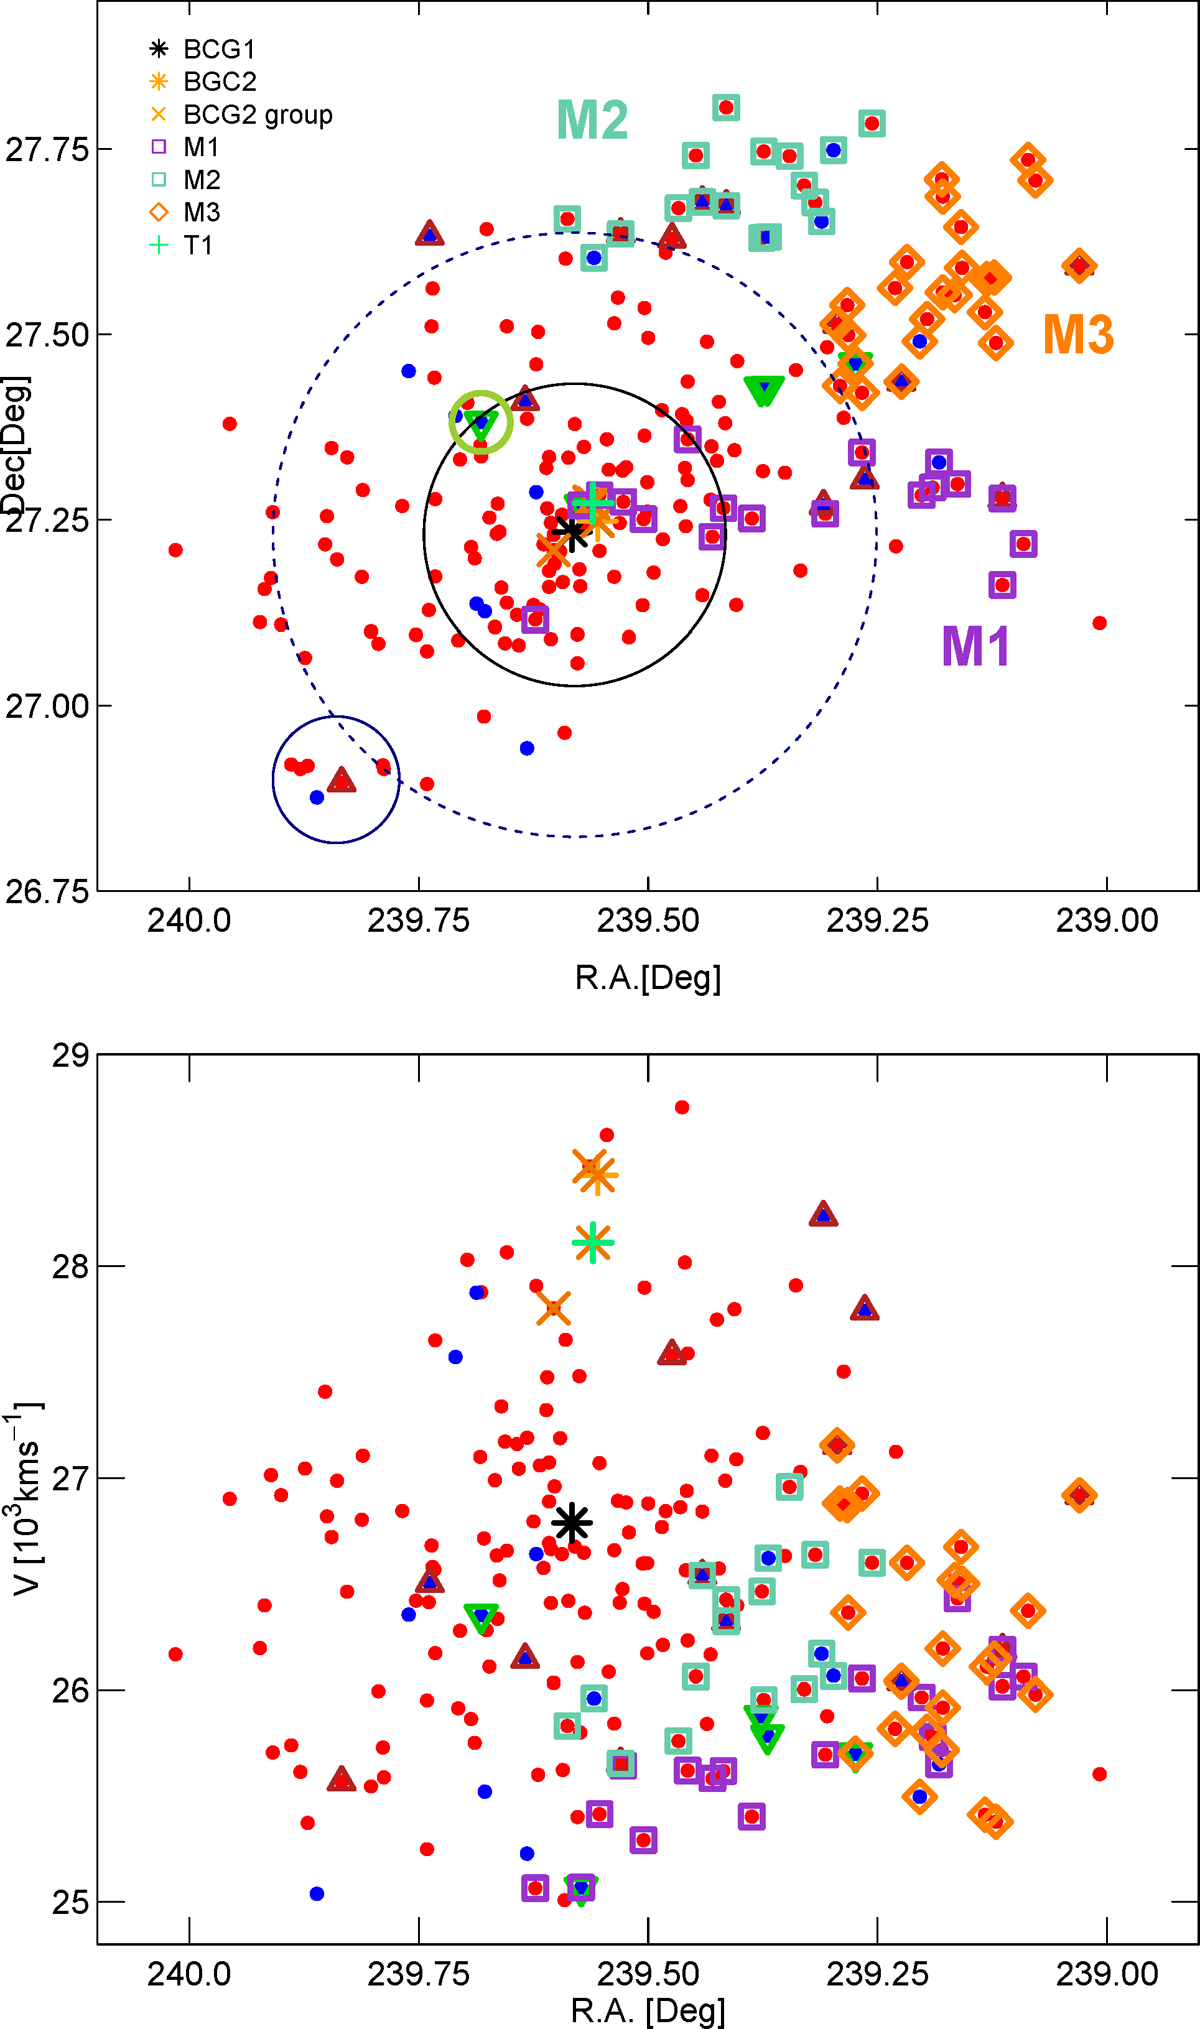
Distribution of galaxies in the cluster A2142 and its outskirts in the sky plane (upper panel) and in the RA – velocity plane (lower panel). Red filled circles correspond to the galaxies with old stellar populations (Dn (4000) ≥ 1.55) and blue filled circles to the galaxies that have young stellar populations with Dn (4000) < 1.55. Green triangles show recently quenched galaxies with Dn(4000) ≤ 1.55 and star formation rate log SFR < −0.5. Red triangles indicate red, high SFR galaxies defined as g − r ≥ 0.7, and log SFR ≥ −0.5 (as in Fig. 3). The black star shows the location of the brightest cluster galaxy (BCG1), and the orange star shows the location of the second BCG (BCG2). The orange crosses show galaxies from a possible BCG2 group. The green cross near the centre denotes a galaxy with a radio tail (T1 in Venturi et al. 2017). The dark violet squares indicate galaxies from subcluster M1, the aquamarine squares indicate galaxies from subcluster M2, and the orange diamonds show galaxies belonging to the third subcluster, M3. The small green circle shows the location of galaxies from infalling group GE described in Eckert et al. (2014), and the navy circle shows the location of galaxies from the poor group, which corresponds to the third component of the cluster (Einasto et al. 2015). The radius of the black circle corresponds to the virial radius of the cluster, Rvir = 0.9 h−1 Mpc, and the radius of the large blue circle (dotted line) corresponds to the radius of the component C1 (main cluster), Rmax = 1.8 h−1 Mpc.
Current usage metrics show cumulative count of Article Views (full-text article views including HTML views, PDF and ePub downloads, according to the available data) and Abstracts Views on Vision4Press platform.
Data correspond to usage on the plateform after 2015. The current usage metrics is available 48-96 hours after online publication and is updated daily on week days.
Initial download of the metrics may take a while.