Fig. 4
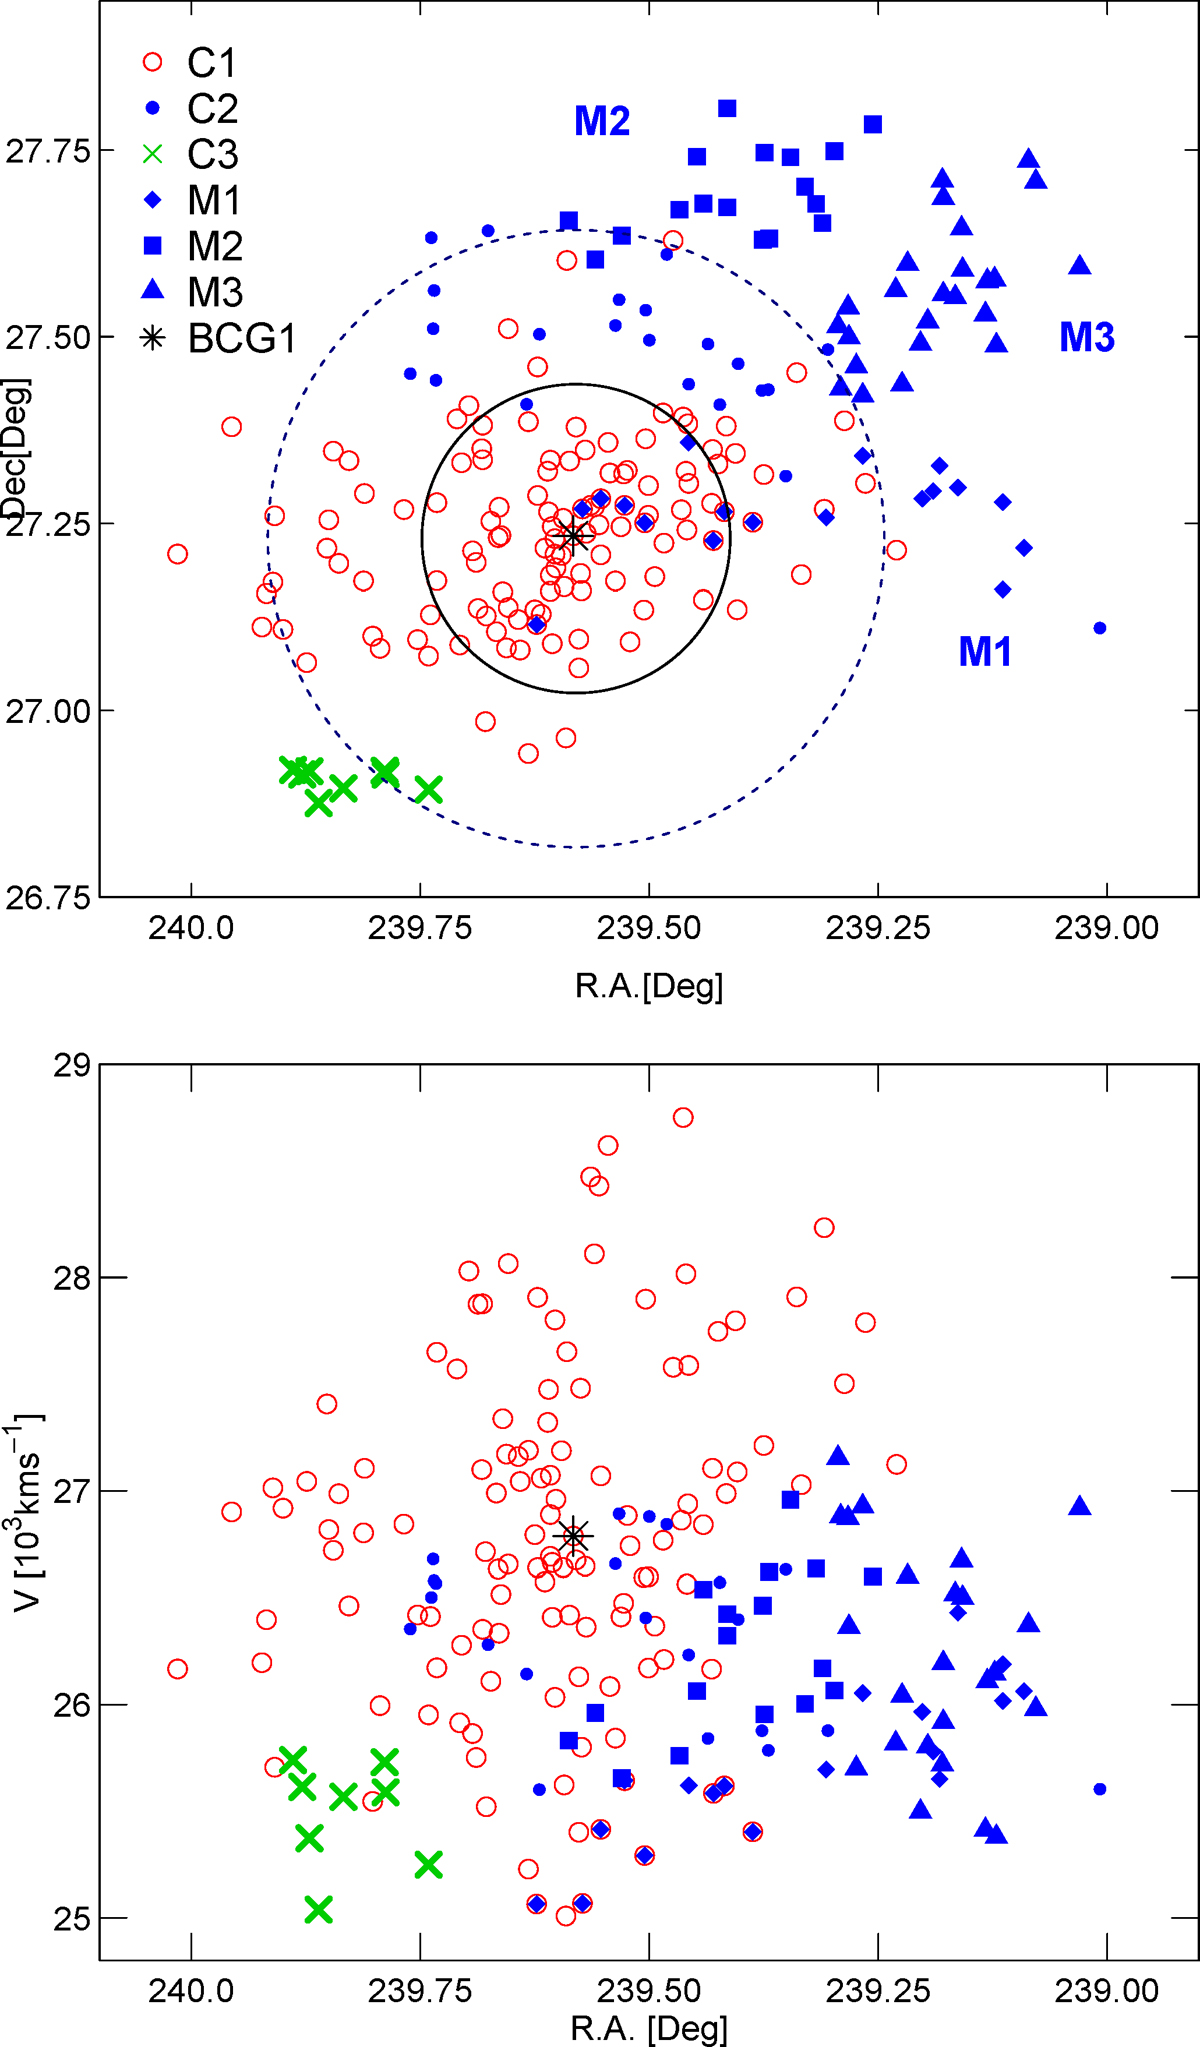
Distribution of galaxies in the cluster A2142 and its outskirts in the sky plane (upper panel) and in the RA – velocity plane (lower panel) in three components found by mclust. Red symbols correspond to the galaxies in the first component, C1. Blue symbols show galaxies from the second component, C2, and green symbols denote the location of galaxies from the third component, C3. Galaxies from the component C2 are divided into subclusters M1 (diamonds), M2 (squares), M3 (triangles), and dots (those component C2 galaxies that are not associated with subclusters) as explained in the text. C1 member galaxies assigned to the subcluster M1 are shown with red circles with blue diamonds (see text). The radius of the small black circle corresponds to the virial radius of the cluster, Rvir = 0.9 h−1 Mpc, and the radius of the large blue circle (dotted line) corresponds to the radius of the component C1 (main cluster), Rmax = 1.8 h−1 Mpc.
Current usage metrics show cumulative count of Article Views (full-text article views including HTML views, PDF and ePub downloads, according to the available data) and Abstracts Views on Vision4Press platform.
Data correspond to usage on the plateform after 2015. The current usage metrics is available 48-96 hours after online publication and is updated daily on week days.
Initial download of the metrics may take a while.