Fig. 3
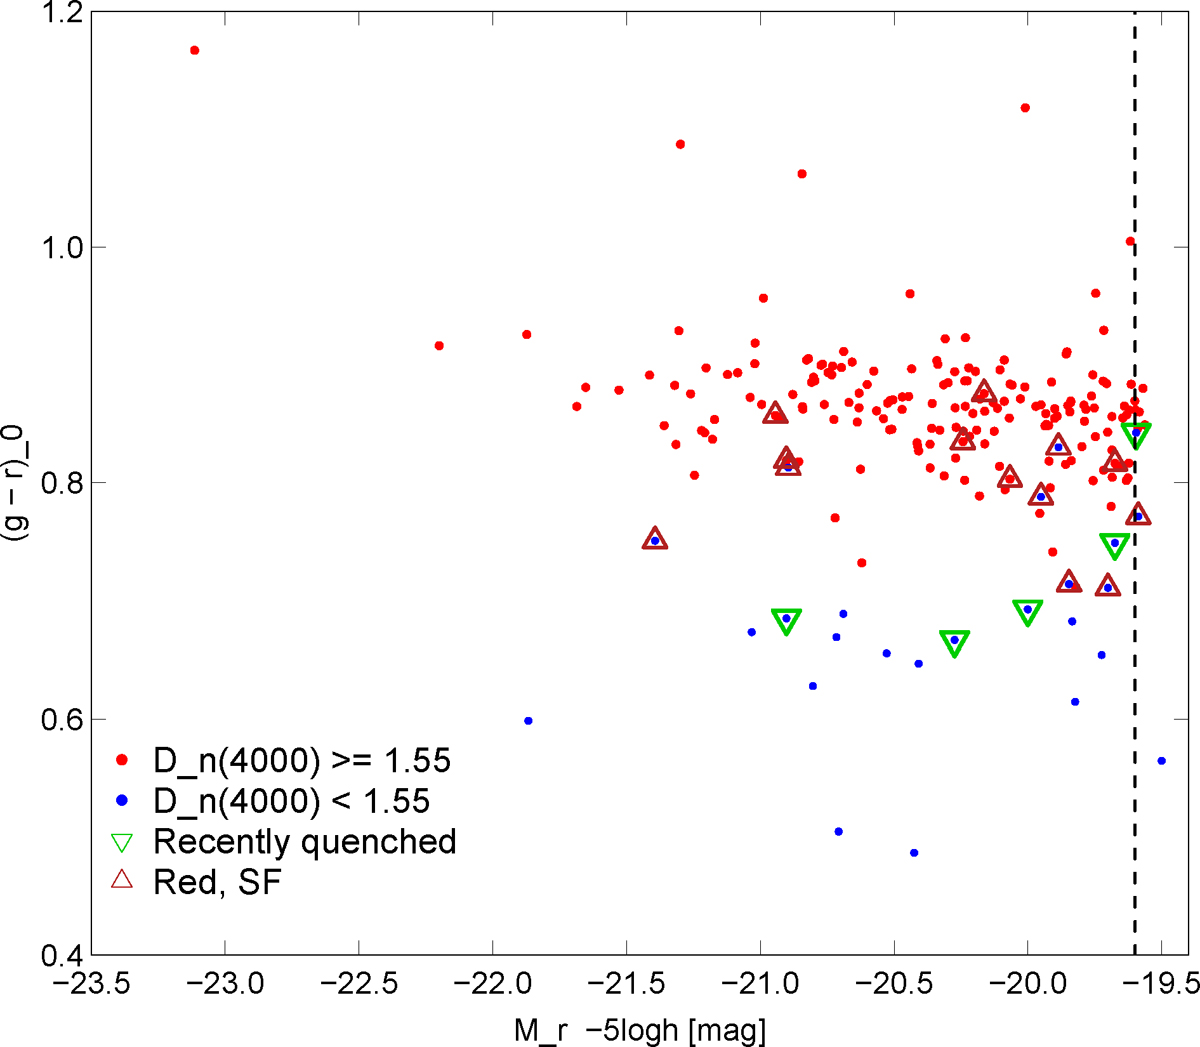
Colour–magnitude diagram ![]() vs. Mr for galaxies in the cluster A2142. The red filled circles correspond to the galaxies with old stellar populations (Dn (4000) ≥ 1.55) and the blue filled circles to the galaxies having young stellar populations with Dn (4000) < 1.55. The green triangles show recently quenched galaxies with Dn(4000) ≤ 1.55 and star formation rate log SFR < −0.5. The red triangles indicate red, high SFR galaxies defined as g − r ≥ 0.7, and log SFR ≥ −0.5. The dashed line shows the completeness limit Mr = −19.6 + 5 log10h.
vs. Mr for galaxies in the cluster A2142. The red filled circles correspond to the galaxies with old stellar populations (Dn (4000) ≥ 1.55) and the blue filled circles to the galaxies having young stellar populations with Dn (4000) < 1.55. The green triangles show recently quenched galaxies with Dn(4000) ≤ 1.55 and star formation rate log SFR < −0.5. The red triangles indicate red, high SFR galaxies defined as g − r ≥ 0.7, and log SFR ≥ −0.5. The dashed line shows the completeness limit Mr = −19.6 + 5 log10h.
Current usage metrics show cumulative count of Article Views (full-text article views including HTML views, PDF and ePub downloads, according to the available data) and Abstracts Views on Vision4Press platform.
Data correspond to usage on the plateform after 2015. The current usage metrics is available 48-96 hours after online publication and is updated daily on week days.
Initial download of the metrics may take a while.