Fig. 13
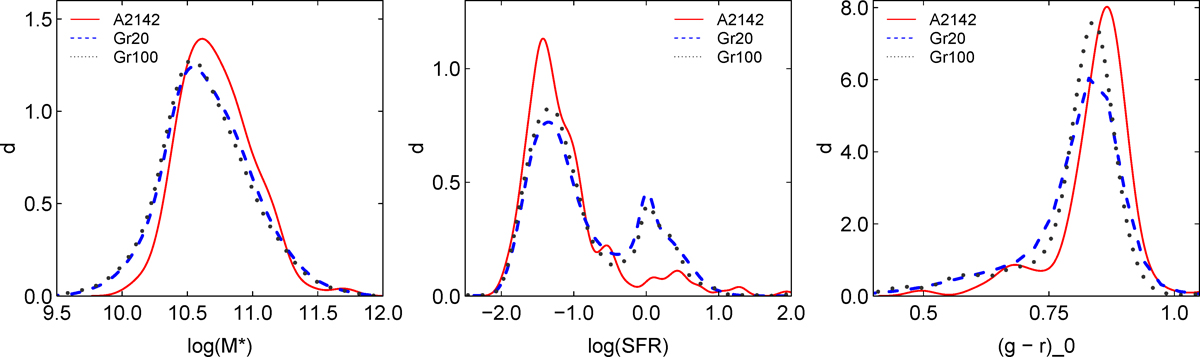
Distributions of stellar masses (left panel), star formation rates (middle panel), and
![]() colours (right panel) of galaxies in the cluster A2142 (red solid line), and in groups with at least 20
and 100 member galaxies (dashed blue and dotted grey lines, correspondingly) in the distance interval
225− 280 h−1 Mpc from
the group catalogue by Tempel et al. (2014b), for galaxies brighter than the completeness limit of A2142,
Mr = −19.6 + 5 log10h.
colours (right panel) of galaxies in the cluster A2142 (red solid line), and in groups with at least 20
and 100 member galaxies (dashed blue and dotted grey lines, correspondingly) in the distance interval
225− 280 h−1 Mpc from
the group catalogue by Tempel et al. (2014b), for galaxies brighter than the completeness limit of A2142,
Mr = −19.6 + 5 log10h.
Current usage metrics show cumulative count of Article Views (full-text article views including HTML views, PDF and ePub downloads, according to the available data) and Abstracts Views on Vision4Press platform.
Data correspond to usage on the plateform after 2015. The current usage metrics is available 48-96 hours after online publication and is updated daily on week days.
Initial download of the metrics may take a while.