Fig. 10
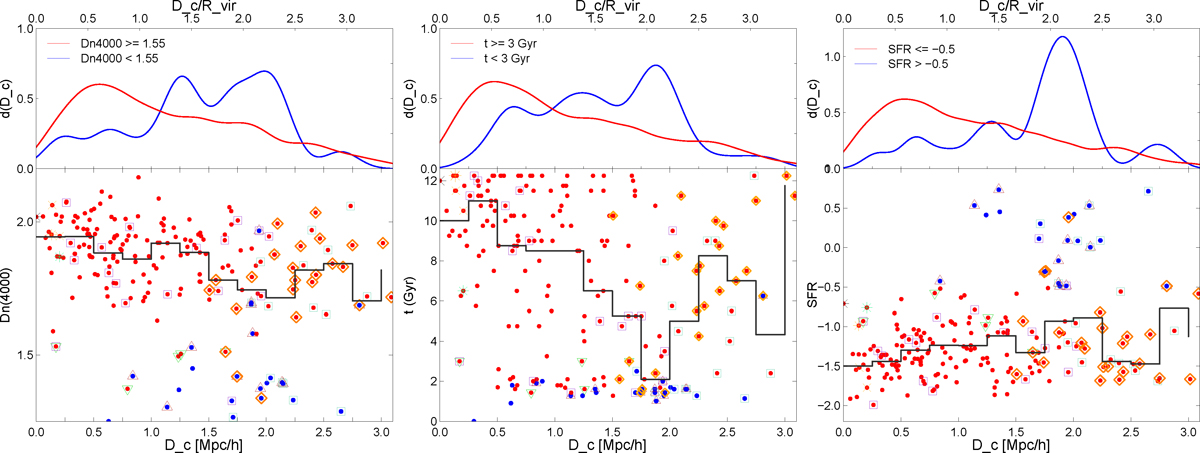
Dn(4000) index (left panel), ages of stellar populations (middle panel), and star formation rates (right panel) for galaxies in A2142 vs. clustercentric distance. The upper panels show the distribution of clustercentric distances for galaxies with young and old stellar populations, and passive and actively star-forming galaxies (see legends in the panels). In the lower panels, the black line shows median values of parameters. Notations are as in Fig. 5, upper panel.
Current usage metrics show cumulative count of Article Views (full-text article views including HTML views, PDF and ePub downloads, according to the available data) and Abstracts Views on Vision4Press platform.
Data correspond to usage on the plateform after 2015. The current usage metrics is available 48-96 hours after online publication and is updated daily on week days.
Initial download of the metrics may take a while.