Fig. 7
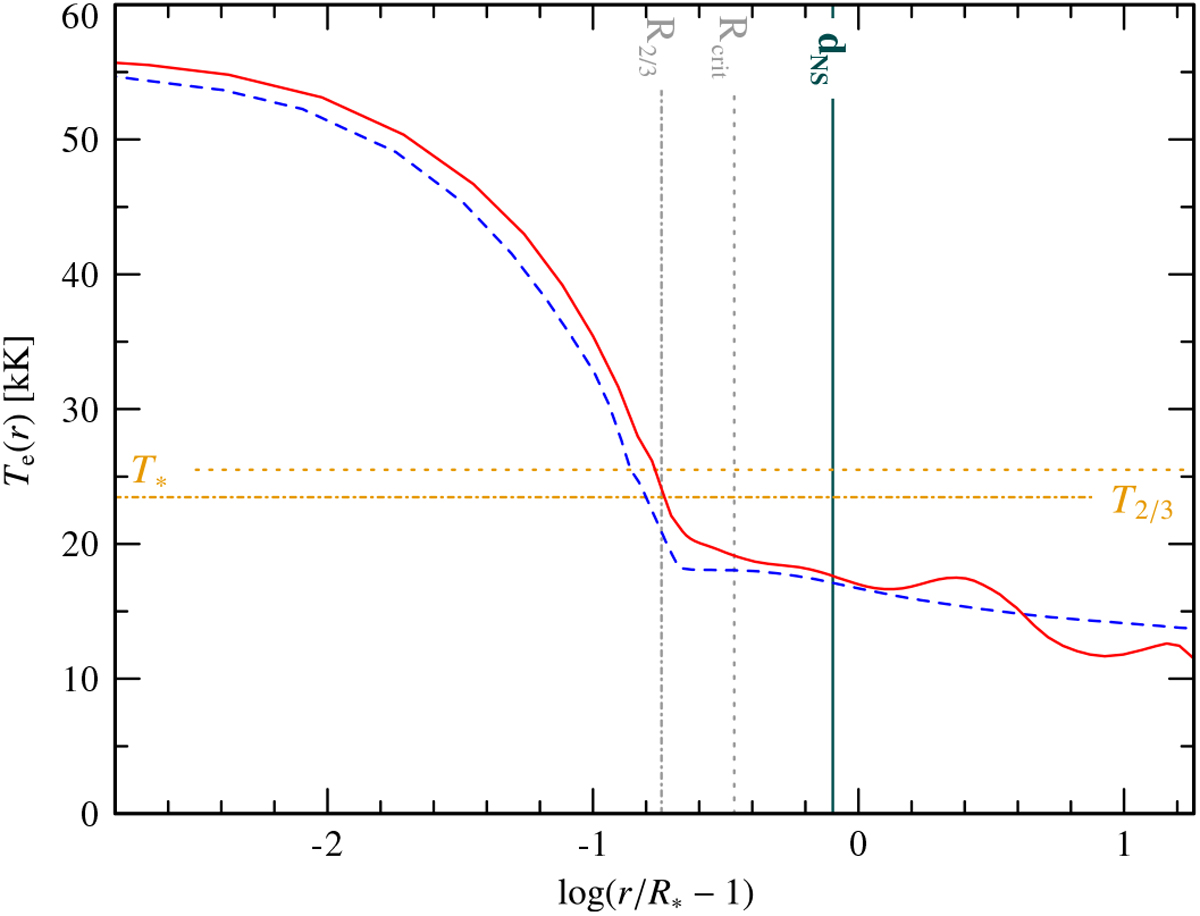
Electron temperature stratification for the HD consistent models (red solid curve) compared to those of a model with a prescribed wind stratification (blue dashed curve) based on Giménez-García et al. (2016). Horizontal lines mark T* and T2∕3 for the HD-models. Vertical lines denote R2∕3 as well as the critical radius for the HD-model without X-rays and the distance of the NS.
Current usage metrics show cumulative count of Article Views (full-text article views including HTML views, PDF and ePub downloads, according to the available data) and Abstracts Views on Vision4Press platform.
Data correspond to usage on the plateform after 2015. The current usage metrics is available 48-96 hours after online publication and is updated daily on week days.
Initial download of the metrics may take a while.