Free Access
Fig. 2
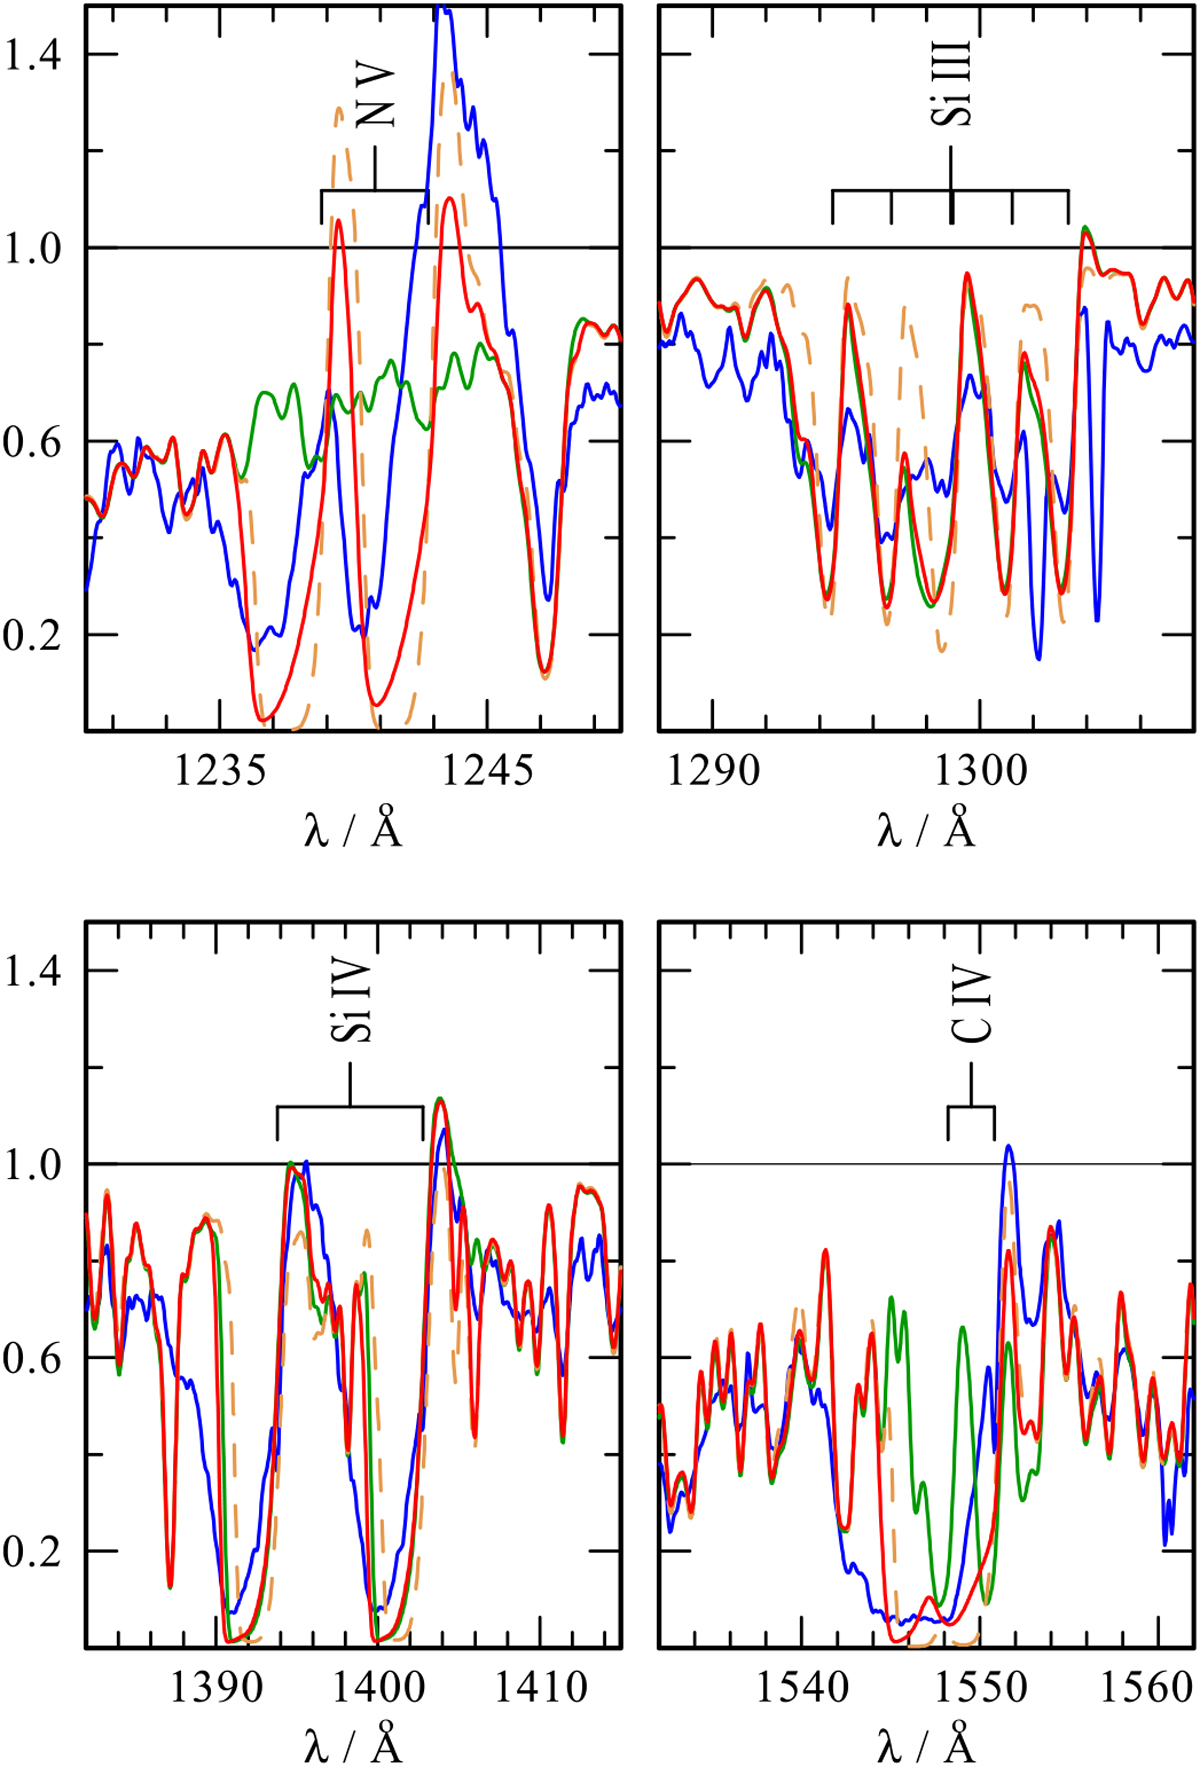
Effect of including X-rays in the atmosphere calculations: The averaged observed normalized spectrum for selected UV lines (blue thin solid line) is compared to HD-PoWR models without (green solid line) as well as with moderate (red solid line) and strong X-ray illumination (brown dashed curve).
Current usage metrics show cumulative count of Article Views (full-text article views including HTML views, PDF and ePub downloads, according to the available data) and Abstracts Views on Vision4Press platform.
Data correspond to usage on the plateform after 2015. The current usage metrics is available 48-96 hours after online publication and is updated daily on week days.
Initial download of the metrics may take a while.