| Issue |
A&A
Volume 610, February 2018
|
|
|---|---|---|
| Article Number | A44 | |
| Number of page(s) | 7 | |
| Section | Catalogs and data | |
| DOI | https://doi.org/10.1051/0004-6361/201731515 | |
| Published online | 26 February 2018 | |
Submillimeter wave spectroscopy of ethyl isocyanide and its searches in Orion★
1
Laboratoire de Physique des Lasers, Atomes, et Molécules, UMR CNRS 8523, Université de Lille I,
59655
Villeneuve d’Ascq Cedex, France
e-mail: This email address is being protected from spambots. You need JavaScript enabled to view it.
2
Grupo de Astrofísica Molecular, Instituto de Ciencia de Materiales de Madrid (ICMM-CSIC),
Sor Juana Inés de la Cruz 3,
28049
Cantoblanco, Madrid, Spain
3
Institut des Sciences Chimiques de Rennes, École Nationale Supérieure de Chimie de Rennes, CNRS, UMR 6226,
11 Allée de Beaulieu, CS 50837,
35708
Rennes Cedex 7, France
Received:
5
July
2017
Accepted:
3
November
2017
Abstract
Context. About 40 cyanide compounds have been detected in the interstellar medium, but only 3 examples of organic isocyanide compounds were observed in this medium. Ethyl isocyanide is one of the best candidates for possible detection.
Aim. To date, measurements of rotational spectra are limited to 40 GHz. The extrapolation of the prediction in the millimeter wave domain is inaccurate and does not permit an unambiguous detection.
Methods. The rotational spectra were reinvestigated from 0.15 to 1 THz. Using the new prediction, we searched for the compound ethyl isocyanide in Orion KL and Sgr B2.
Results. We newly assigned 2906 transitions and fitted these new data with those from previous studies, reaching quantum numbers up to J = 103 and Ka = 30. The asymmetric top Hamiltonian proposed by Watson in the Ir representation was used for the analysis, and both reductions A and S were tested. The search for CH3CH2NC in Sgr B2 (IRAM 30m) and Orion KL (IRAM 30m, ALMA Science Verification) result in a non-detection; upper limits to the column density were derived.
Key words: ISM: molecules / methods: laboratory: molecular / submillimeter: ISM / molecular data / line: identification
Tables S1–S4 are only available at the CDS via anonymous ftp to cdsarc.u-strasbg.fr (130.79.128.5) or via http://cdsarc.u-strasbg.fr/viz-bin/qcat?J/A+A/610/A44
© ESO 2018
1 Introduction
Almost 40 organic and inorganic nitriles (cyanides) have been detected in the interstellar medium (ISM) and the first branched molecule recently detected in the ISM is a nitrile compound (Belloche et al. 2014). On the other hand, only 3 organic isocyanides, namely, methylisocyanide (CH3NC) (Remijan et al. 2005), vinylisocyanide (tentatively, H2C=CH–NC) (López et al. 2014), and ethynylisocyanide (HC≡C–NC) (Kawaguchi et al. 1992); the parent compound HNC (Schilke et al. 2001), and some inorganic isocyanides (AlNC, MgNC Ziurys 2006, such as SiNC Guélin et al. 2004, and HMgNC Cabezas et al. 2013) were also observed in this medium. In the atmosphere of Titan, attempts to detect isocyanides, where many nitriles are present, has recently led to the observation of HNC (Moreno et al. 2011). Under laboratory conditions, isocyanides rearrange on heating into the thermodynamically more stable cyanide isomers (Wolber et al. 1992; Lattelais et al. 2010), but some photochemical studies revealed the opposite rearrangement under irradiation (Coupeaud et al. 2007; Toumi et al. 2014). If such a photochemical rearrangement occurs in the ISM or if another process is able to generate isocyanides from the corresponding cyanides in this medium, the probability that these isocyanides isomers of detected nitriles could be interstellar compounds could be very high. Following the relative abundance of these nitriles, the ethyl isocyanide is one of the best candidates for such studies. We search for ethyl isocyanide in two high-mass star-forming regions in which large abundances of ethyl cyanide and related species have been found: Orion KL and Sgr B2 (Sect. 4).
2 Experimental section
Ethyl isocyanide has been synthesized starting from N-ethylformamide as previously reported for other low-boiling derivatives (Chrostowska et al. 2012).
The measurements in the frequency range under investigation (150–990 GHz) were performed using the Lille spectrometer (Zakharenko et al. 2015). The absorption cell was a stainless steel tube (6 cm diameter and 220 cm long). The sample pressure during measurements was about 10 Pa and at room temperature, the line width was limited by Doppler broadening. The frequency ranges 150–330, 400–660, and 780–990 GHz were covered with various active and passive frequency multipliers from VDI Inc. and an Agilent synthesizer (12.5–18.25 GHz) was used as the source of radiation. Estimated uncertainties for measured line frequencies are 30 and 50 kHz, depending on the observed S/N and frequency range.
3 Analysis of the spectra
The first investigations of the rotational spectra of ethyl isocyanide were carried out in 1966 by Bolton et al. (1966). The spectra of the first vibrational and torsional excited states were measured in the centimeter wave domain (Anderson & Gwinn 1968). In this initial study, the dipole moment was determined to be μa = 3.79 D and μb = 1.31 D; this value is usually large for a molecule that includes a CN group. This causes dense and intense rotational spectra in the millimeter wave range and also in the submillimeter wave range up to 900 GHz (bQ lines). Anderson & Gwinn (1968) also observed some A–E splittings due to the internal rotation motion of the methyl group. The most recent spectroscopic study is from Krüger & Dreizler (1992) who reinvestigated the internal rotation measurements and also determined hyperfine coupling parameters due to the nitrogen quadrupole. As in our previous studies of ethyl cyanide isotopologs, it was not possible to observe internal rotation and hyperfine splittings due to our Doppler limited resolution. Our analysis was rather easy, starting from a prediction based on Krüger & Dreizler (1992) parameters. First, we analyzed and fit the most intense transitions, the aRh transitions, up to 330 GHz. These transitions were shifted only a few MHz from the initial predictions. Then bR and bQ lines were searched and included in the fit up to 330 GHz. Next, all the spectra were analyzed up to 990 GHz without difficulty. For the fitting, we employed ASFIT (Kisiel 2001) and predictions were made with SPCAT (Pickett 1991). The global fits included 6 transitions from Anderson & Gwinn (1968), 29 lines from Krüger & Dreizler (1992), and 2906 from this work. The maximal quantum numbers are J = 103 and Ka = 30. Both reductions A and S were tested. A reduction permits us to check theagreement of our new parameters set with those from Krüger & Dreizler (1992) (Table 1). Using S reduction slightly decreases root mean square from 30.3 to28.7 kHz. The condition numbers are nearly the same: 295 and 310 for the A and S reductions, respectively.The A reduction requires 23 parameters, but 5 additional parameters are required for the S reduction (Table 2). For this reason we used the A reduction even if this molecule is close to the prolate limit with kappa = −0.9521. Part of the new measurements are in Table 3. Owing to its large size, the complete version of the global fit Table S1 is supplied at the CDS. The fitting files .lin (S2), .par (S3), and the prediction .cat (S4) are also available at CDS.
Spectroscopic parameters of ethyl isocyanide in MHz – reduction A.
Spectroscopic parameters of ethyl isocyanide in MHz – reduction S.
Measured frequencies of ethyl isocyanide and residuals from the fit.
4 Radioastronomical observations
Ethyl cyanide (CH3 CH2CN) is one of themost abundant molecules in hot cores (see, e.g., Blake et al. 1987; Belloche et al. 2009; Daly et al. 2013). In addition to the main isotopolog in the ground state, many rare isotopologs and vibrationally excited states have been detected in high-mass star-forming regions (Demyk et al. 2007; Margulès et al. 2009, 2016; Daly et al. 2013; Belloche et al. 2013). In contrast to ethyl cyanide, the other abundant cyanides in these regions, i.e., methyl cyanide (CH3 CN; see, e.g., Bell et al. 2014) and vinyl cyanide (CH2 CHCN; see, e.g., López et al. 2014) have been also identified in cold clouds (Matthews & Sears 1983a,b). Nevertheless, the non-detection of ethyl cyanide in dark clouds may be a detection limit issue since the results of Remijan et al. (2005) suggest a very cold component of ethyl cyanide in the extended envelope of Sagittarius (Sgr) B2. This may suggest that, whereas methyl and vinyl cyanide can be easily formed in the gas phase, grain surface production seemed to be a prominent formation route for CH3 CH2CN (Blake et al. 1987; Charnley et al. 1992; Caselli et al. 1993; Garrod et al. 2008). In addition, non-thermal processes (e.g., shocks) could release ethyl cyanide and other species into the gas phase from the grain mantles in the cold envelope of Sgr B2.
Concerning the isocyanide counterparts of these species, only methyl isocyanide has been unambiguously detected. The first tentative detections were toward the cold cloud TMC-1 (Irvine & Schloerb 1984) and the high-mass star-forming region Sgr B2 (Cernicharo et al. 1988). The confirmation of the presence of CH3 NC in the cold clouds of Sgr B2 was reported by Remijan et al. (2005). The compound CH3 NC has also been detected at millimeter frequencies toward the Horsehead photodissociation region (PDR) by Gratier et al. (2013). However, Cuadrado et al. (2017) did not detect CH3 NC in the Orion Bar, a much more strongly far-UV-irradiated PDR. These detections suggest that, as proposed by Remijan et al. (2005), non-thermal processes, such as shocks or enhanced UV flux in the surrounding medium, may be the primary route to the formation of interstellar isocyanides by the conversion of the cyanide to its isocyanide counterpart. Moreover, the detection of CH3 NC in the hot core of Orion KL, by López et al. (2014), and the tentative detection of this species toward the continuum peak of L1544, by Jiménez-Serra et al. (2016), point out that other formation routes (and a probable origin for the isocyanides from reactions on grain mantles) have to be explored to explain their presence in such a large range of astronomical environments. Furthermore, the tentative detection provided by Cernicharo et al. (1988) in the millimeter domain suggested that CH3 NC can be also found in the warm regions of the Sgr B2 complex.
Hence, to search for CH3 CH2NC in the ISM we focused on public data of the two prototypical high-mass star-forming regions, Orion KL and Sgr B2.
Orion KL: López et al. (2014) carried out a search for the isocyanide species in Orion KL using the IRAM 30m survey of this region (Tercero et al. 2010). As mentioned above, these authors detected CH3 NC toward the source. They also provided a tentative detection for CH2 CHNC and an upper limit to the column density of CH3 CH2NC. The molecular column densities for these species derived by these authors are summarized in Table 4.
In this work we used the ALMA Science Verification (SV) data of Orion KL (see, e.g., Tercero et al. 2015 for observations and data reduction) to search for ethyl isocyanide. First, we studied the spatial distribution of ethyl cyanide in the source by performing integrated intensity maps of several CH3 CH2CN lines free of blending that cover a large range of energies for the upper level of the involved transitions (see Fig. 1). We noted three main emission peaks of ethyl cyanide in the region (see Fig. 1): EtCN1, a position south source I in the hot core clumpy structure (see, e.g., Favre et al. 2011)that can be associated to the emission peak of several N-bearing species in the source, such as DCN, HC3 N, CH3 CN, and CH2 CHCN (Cernicharo et al. 2016); EtCN2, toward the millimeter continuum source MM4 (Wu et al. 2014), which concentrates a large percentage of the emission of several complex organic molecules (COMs), such as CH3 NCO (Cernicharo et al. 2016) and CH3 COCH3 (Peng et al. 2013); and EtCN3, a position northeast source I, which presents prominent emission of complex species with nitrogen (Guélin et al. 2008; Weaver & Friedel 2012). Coordinates of these positions are shown in Table 1. Then, we extracted and averaged a 5 × 5 pixel spectrum around these emission peaks to search for ethyl isocyanide. Observed lines parameters for the CH3 CH2CN emission in these regions were obtained by fitting Gaussian profiles to a CH3 CH2CN 20 = 1 line (see Fig. 2). To model the CH3 CH2NC emission at these positions, we considered these observed line parameters and an average kinetic temperature of 200 K (see Daly et al. 2013; López et al. 2014). Table 5 summarizes the assumed physical parameters for each cloud component. We used the MADEX code (Cernicharo 2012) to derive the synthetic spectrum of methyl isocyanide according to the CH3 CH2NC spectroscopy reported in this work and assuming the physical parameters shown in Table 5. We did not find ethyl isocyanide above the detection limit of the data. Upper limits to the CH3 CH2NC column density are shown in Table 4.
Considering the same cloud components and physical parameters as those used for CH3 CH2NC, we derived molecular column densities for methyl and vinyl isocyanide (see Table 4). In the EtCN1 position, most of the methyl isocyanide lines are hidden by the emission of more abundant species in the ALMA SV frequency range. However, we found four CH3 NC lines partially free of blending toward EtCN2 and EtCN3 emission peaks (see Fig. A.1). This is compatible with the CH3 NC detection inOrion by López et al. (2014). On the other hand, we did not detect CH2 CHNC in the ALMA SV.
In orderto provide isocyanide/cyanide column density ratios, we also derived molecular column densities for CH3 CN and CH3 CH2CN in EtCN3 and for CH2CHCN in all the considered components according to the physical parameter shown in Table 5. The column densities formethyl and ethyl cyanide toward EtCN1 and EtCN2 weretaken from Cernicharo et al. (2016). Whereas the methyl and ethyl ratios are on the same order of magnitude as those derived by López et al. (2014), we obtained a vinyl upper limit ratio one order of magnitude lower than the value of these authors. This is mostly due to the differences in the telescope beam (see Table 4) that give rise to a high level of line blending and line confusion in the spectrum of the 30 m telescope. Nevertheless, owing to the limited frequency band of the ALMA SV data, we cannot disclaim the tentative detection of CH2 CHNC reported by López et al. (2014).
Sgr B2: Methyl, ethyl, and vinyl isocyanides were searched for by Remijan et al. (2005) in the Sgr B2 complex using data obtained with the Green Bank Telescope in the centimeter domain. These authors reported the detection of CH3 NC, the tentative detection of CH2CHNC, and an upper limit to the CH3 CH2NC column density. These data trace the coldest regions of Sgr B2.
In order to search for these species in the warm gas of this region, we used the public data of Sgr B2 at 3 mm collected with the IRAM 30m telescope and provided by Belloche et al. (2013). To obtain a synthetic spectrum for CH3 NC, CH3 CH2NC, and CH2 CHNC, we used MADEX assuming the same physical components as those derived by Belloche et al. (2013) for CH3 CN, CH3 CH2CN, and CH2 CHCN toward Sgr B2 (N). It is worth noting that the rotational temperatures used to model the emission of these species in the region were 200 K for CH3 CN and 170 K for CH3 CH2CNand CH2 CHCN in all the components considered by these authors.
As Remijan et al. (2005), we only detected CH3 NC above the detection limit of these data (see Fig. 3). For ethyl and vinyl isocyanide we only can provide upper limits to their column density (see Table 4). This detection is in agreement with the previous tentative detection of CH3 NC in the millimeter domain reported by Cernicharo et al. (1988). Moreover, as we mentioned above, the CH3 NC model shown in Fig. 3 was obtained using a single rotational temperature of 200 K. Because the interconversion from CH3 CN to CH3 NC is very unfavorable under these thermal conditions, the presence of CH3 NC in warm regions could also point to a possible grain chemistry pathway (different from that of CH3 CN) for the production of this species. Nevertheless, the detection of a warm component of CH3 NC does not necessarily imply a warm chemical formation route. The COMs in hot molecular clouds could have their origins in cooler regions or through other non-thermalprocesses. Nevertheless, we obtained a CH3 NC/CH3CN column density ratio of 0.01. This value is in agreement with that of0.02 reported by Remijan et al. (2005) and the upper limit value of 0.05 derived by Cernicharo et al. (1988), and it is three times larger than the N(CH3CN)/N(CH3NC) value obtained in Orion KL.
Interestingly, the CH3 NC/CH3CN abundance ratio derived in the Horsehead PDR by Gratier et al. (2013) is 0.15, that is, 2–5 times higher than the results in the considered high-mass star-forming regions. These authors pointed out that the value in the PDR falls directly in the range predicted by DeFrees et al. (1985) who found that the formation rate ratio of the protonated precursor ions (CH3 NCH+/CH3CNH+) was between 0.1 and 0.4, according to gas phase, ion-molecule treatment. This ratio also agrees with the value in dark clouds (Irvine & Schloerb 1984). In addition to the formation of cis-HCOOH (Cuadrado et al. 2016), the photo-switching mechanism should be considered to explain the presence of CH3 NC in the Horsehead PDR. The fact that CH3 NC was not detected toward the Orion Bar (Cuadrado et al. 2017), a more strongly illuminated PDR (>100 times more than the Horsehead), which has a similar electron densities, could be explained by the strong dependence of the photo-switching process on the flux of high-energy far-UV photons.
On the other hand, laboratory experiments conducted by Hudson & Moore (2004) found that ethyl isocyanide was one of the main products in far-UV photolyses (157–170 nm) of solid samples of CH3 CN and CH3 CN + N2 at low temperatures (12–25 K) and UV doses of a few eV molecule−1; that is, the same order of magnitude as that received by the ices in dense molecular clouds during the lifetime of the cloud. This also suggests the formation of this species toward the grain mantles in different environments with specific conditions for the FUV flux. Subsequently, CH3NC gas phase abundance could be enhanced when ice mantles of grains are destroyed through photo-desorption, thermal evaporation or sputtering depending on the prevailing physical conditions.
Isocyanide column densities and N(X-NC)/N(X-CN) ratios.
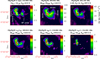 |
Fig. 1 Spatial distribution of CH3 CH2CN in Orion KL. The data are from ALMA SV observations. The yellowellipse at the top left corner of the maps represents the synthetic beam. For a brief description of the marked positions in the first left panel, see, e.g., Cernicharo et al. (2016). The three main emission peaks of CH3 CH2CN are indicated in the middle top panel. |
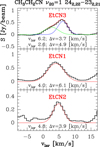 |
Fig. 2 Gaussian fits to the 242,22 –232,21 (219.632 GHz) line of CH3CH2CN 20 = 1 at various positions within Orion KL. |
Physical parameters.
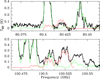 |
Fig. 3 Lines of CH3NC in Sgr B2 (N) at 3 mm. Observed data (black histogram spectrum) and total model of the source (green curve) are from Belloche et al. (2013). Our best model for CH3 NC is given by the red line. A vLSR of +64.0 km s−1 is assumed. |
5 Conclusion
Submillimeter wave spectra of the ethyl isocyanide, an isomer of one of the most abundant complex organic molecules was assigned up to 1 THz. This permits us to predict accurately in the ALMA range and make its detection possible in the near future.
Acknowledgments
The present investigations were supported by the CNES and the CNRS program “Physique et Chimie du Milieu Interstellaire” (PCMI). This work was also done under ANR-13-BS05-0008 IMOLABS. This paper makes use of the following ALMA data: ADS/JAO.ALMA#2011.0.00009.SV. ALMA is a partnership of ESO (representing its member states), NSF (USA), and NINS (Japan) with NRC (Canada), NSC, and ASIAA (Taiwan), and KASI (Republic of Korea), in cooperation with the Republic of Chile. The Joint ALMA Observatory is operated by ESO, AUI/NRAO, and NAOJ. This work was also based on observations carried out with the IRAM 30 meter telescope. IRAM is supported by INSU/CNRS (France), MPG (Germany), and IGN (Spain). B.T. and J.C. thank MINECO for funding support from the CONSOLIDER-Ingenio program “ASTROMOL” CSD 2009-00038, AYA2012-32032, CTQ 2013-40717 P, CTQ 2010-19008, and the ERC synergy grant ERC-2013-Syg-610256-NANOCOSMOS.
Appendix A Detection of CH3NC in Orion
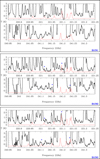 |
Fig. A.1 CH3NC lines in Orion toward EtCN1, EtCN2, and EtCN3 emission peaks. Lines partially free of blending with other species are denoted with *. |
References
- Anderson, R. J., & Gwinn, W. D. 1968, J. Chem. Phys., 49, 3988 [NASA ADS] [CrossRef] [Google Scholar]
- Bell, T. A., Cernicharo, J., Viti, S., et al. 2014, A&A, 564, A114 [NASA ADS] [CrossRef] [EDP Sciences] [Google Scholar]
- Belloche, A., Garrod, R., Müller, H., et al. 2009, A&A, 499, 215 [NASA ADS] [CrossRef] [EDP Sciences] [Google Scholar]
- Belloche, A., Müller, H. S., Menten, K. M., Schilke, P., & Comito, C. 2013, A&A, 559, A47 [NASA ADS] [CrossRef] [EDP Sciences] [Google Scholar]
- Belloche, A., Garrod, R. T., Müller, H. S., & Menten, K. M. 2014, Science, 345, 1584 [NASA ADS] [CrossRef] [PubMed] [Google Scholar]
- Blake, G. A., Sutton, E., Masson, C., & Phillips, T. 1987, ApJ, 315, 621 [NASA ADS] [CrossRef] [Google Scholar]
- Bolton, K., Curnuck, P., Owen, N., & Sheridan, J. 1966, Nature, 212, 1229 [Google Scholar]
- Cabezas, C., Cernicharo, J., Alonso, J. L., et al. 2013, ApJ, 775, 133 [NASA ADS] [CrossRef] [Google Scholar]
- Caselli, P., Hasegawa, T., & Herbst, E. 1993, ApJ, 408, 548 [NASA ADS] [CrossRef] [Google Scholar]
- Cernicharo, J., Kahane, C., Guelin, M., & Gomez-Gonzalez, J. 1988, A&A, 189, L1 [NASA ADS] [Google Scholar]
- Cernicharo, J., 2012, in ECLA-2011: Proc. Eur. Conf. Lab. Astrophys., eds. C. Stehlé, C. Joblin, & L. D’Hendecourt, EAS Pub. Ser., 58, 251 [Google Scholar]
- Cernicharo, J., Kisiel, Z., Tercero, B., et al. 2016, A&A, 587, L4 [NASA ADS] [CrossRef] [EDP Sciences] [Google Scholar]
- Charnley, S., Tielens, A., & Millar, T. 1992, ApJ, 399, L71 [NASA ADS] [CrossRef] [Google Scholar]
- Chrostowska, A., Matrane, A., Maki, D., et al. 2012, ChemPhysChem, 13, 226 [CrossRef] [Google Scholar]
- Coupeaud, A., Turowski, M., Gronowski, M., et al. 2007, J. Chem. Phys., 126, 164301 [NASA ADS] [CrossRef] [Google Scholar]
- Cuadrado, S., Goicoechea, J., Roncero, O., et al. 2016, A&A, 596, L1 [NASA ADS] [CrossRef] [EDP Sciences] [Google Scholar]
- Cuadrado, S., Goicoechea, J. R., Cernicharo, J., et al. 2017, A&A, 603, A124 [NASA ADS] [CrossRef] [EDP Sciences] [Google Scholar]
- Daly, A., Bermúdez, C., López, A., et al. 2013, ApJ, 768, 81 [NASA ADS] [CrossRef] [Google Scholar]
- DeFrees, D., McLean, A., & Herbst, E. 1985, ApJ, 293, 236 [NASA ADS] [CrossRef] [Google Scholar]
- Demyk, K., Mäder, H., Tercero, B., et al. 2007, A&A, 466, 255 [NASA ADS] [CrossRef] [EDP Sciences] [Google Scholar]
- Favre, C., Wootten, H., Remijan, A., et al. 2011, ApJ, 739, L12 [NASA ADS] [CrossRef] [Google Scholar]
- Garrod, R. T., Weaver, S. L. W., & Herbst, E. 2008, ApJ, 682, 283 [NASA ADS] [CrossRef] [Google Scholar]
- Gratier, P., Pety, J., Guzmán, V., et al. 2013, A&A, 557, A101 [NASA ADS] [CrossRef] [EDP Sciences] [Google Scholar]
- Guélin, M., Muller, S., Cernicharo, J., McCarthy, M., & Thaddeus, P. 2004, A&A, 426, L49 [NASA ADS] [CrossRef] [EDP Sciences] [Google Scholar]
- Guélin, M., Brouillet, N., Cernicharo, J., Combes, F., & Wooten, A. 2008, in Science with the Atacama Large Millimeter Array (Dordrecht: Springer), 45 [CrossRef] [Google Scholar]
- Hudson, R. L.& Moore, M. H. 2004, Icarus, 172, 466 [NASA ADS] [CrossRef] [Google Scholar]
- Irvine, W. M., & Schloerb, F. 1984, ApJ, 282, 516 [Google Scholar]
- Jiménez-Serra, I., Vasyunin, A. I., Caselli, P., et al. 2016, ApJ, 830, L6 [Google Scholar]
- Kawaguchi, K., Ohishi, M., Ishikawa, S.-I., & Kaifu, N. 1992, ApJ, 386, L51 [NASA ADS] [CrossRef] [Google Scholar]
- Kisiel, Z. 2001, in Spectroscopy from Space (Dordrecht: Springer), 91 [CrossRef] [Google Scholar]
- Krüger M., & Dreizler, H. 1992, Z. Naturforschung A, 47, 1067 [Google Scholar]
- Lattelais, M., Ellinger, Y., Matrane, A., & Guillemin, J.-C. 2010, Phys. Chem. Chem. Phys., 12, 4165 [Google Scholar]
- López, A., Tercero, B., Kisiel, Z., et al. 2014, A&A, 572, A44 [NASA ADS] [CrossRef] [EDP Sciences] [Google Scholar]
- Margulès, L., Motiyenko, R., Demyk, K., et al. 2009, A&A, 493, 565 [NASA ADS] [CrossRef] [EDP Sciences] [Google Scholar]
- Margulès, L., Belloche, A., Müller, H., et al. 2016, A&A, 590, A93 [NASA ADS] [CrossRef] [EDP Sciences] [Google Scholar]
- Matthews, H., & Sears, T. 1983a, ApJ, 267, L53 [NASA ADS] [CrossRef] [Google Scholar]
- Matthews, H., & Sears, T. 1983b, ApJ, 272, 149 [NASA ADS] [CrossRef] [Google Scholar]
- Moreno, R., Lellouch, E., Lara, L., et al. 2011, A&A, 536, L12 [NASA ADS] [CrossRef] [EDP Sciences] [Google Scholar]
- Peng, T.-C., Despois, D., Brouillet, N., et al. 2013, A&A, 554, A78 [NASA ADS] [CrossRef] [EDP Sciences] [Google Scholar]
- Pickett, H. M. 1991, J. Mol. Spectr., 148, 371 [NASA ADS] [CrossRef] [Google Scholar]
- Remijan, A. J., Hollis, J., Lovas, F., Plusquellic, D., & Jewell, P. 2005, ApJ, 632, 333 [NASA ADS] [CrossRef] [Google Scholar]
- Schilke, P., Benford, D., Hunter, T., Lis, D., & Phillips, T. 2001, ApJS, 132, 281 [NASA ADS] [CrossRef] [Google Scholar]
- Tercero, B., Cernicharo, J., Pardo, J., & Goicoechea, J. 2010, A&A, 517, A96 [NASA ADS] [CrossRef] [EDP Sciences] [Google Scholar]
- Tercero, B., Cernicharo, J., López, A., et al. 2015, A&A, 582, L1 [NASA ADS] [CrossRef] [EDP Sciences] [Google Scholar]
- Toumi, A., Couturier-Tamburelli, I., Chiavassa, T., & Piétri, N. 2014, J. Phys. Chem. A, 118, 2453 [CrossRef] [Google Scholar]
- Weaver, S. L. W., & Friedel, D. N. 2012, ApJS, 201, 16 [NASA ADS] [CrossRef] [Google Scholar]
- Wolber, E. K. A., Schmittel, M., & Rüchardt, C. 1992, Chemische Berichte, 125, 525 [CrossRef] [Google Scholar]
- Wu, Y., Liu, T., & Qin, S.-L. 2014, ApJ, 791, 123 [NASA ADS] [CrossRef] [Google Scholar]
- Zakharenko, O., Motiyenko, R. A., Margulès, L., & Huet, T. R. 2015, J. Mol. Spectr., 317, 41 [Google Scholar]
- Ziurys, L. M. 2006, Proc. Natl. Acad. Sci., 103, 12274 [NASA ADS] [CrossRef] [Google Scholar]
All Tables
All Figures
|
Fig. 1 Spatial distribution of CH3 CH2CN in Orion KL. The data are from ALMA SV observations. The yellowellipse at the top left corner of the maps represents the synthetic beam. For a brief description of the marked positions in the first left panel, see, e.g., Cernicharo et al. (2016). The three main emission peaks of CH3 CH2CN are indicated in the middle top panel. |
| In the text | |
|
Fig. 2 Gaussian fits to the 242,22 –232,21 (219.632 GHz) line of CH3CH2CN 20 = 1 at various positions within Orion KL. |
| In the text | |
|
Fig. 3 Lines of CH3NC in Sgr B2 (N) at 3 mm. Observed data (black histogram spectrum) and total model of the source (green curve) are from Belloche et al. (2013). Our best model for CH3 NC is given by the red line. A vLSR of +64.0 km s−1 is assumed. |
| In the text | |
|
Fig. A.1 CH3NC lines in Orion toward EtCN1, EtCN2, and EtCN3 emission peaks. Lines partially free of blending with other species are denoted with *. |
| In the text | |
Current usage metrics show cumulative count of Article Views (full-text article views including HTML views, PDF and ePub downloads, according to the available data) and Abstracts Views on Vision4Press platform.
Data correspond to usage on the plateform after 2015. The current usage metrics is available 48-96 hours after online publication and is updated daily on week days.
Initial download of the metrics may take a while.