Fig. 4
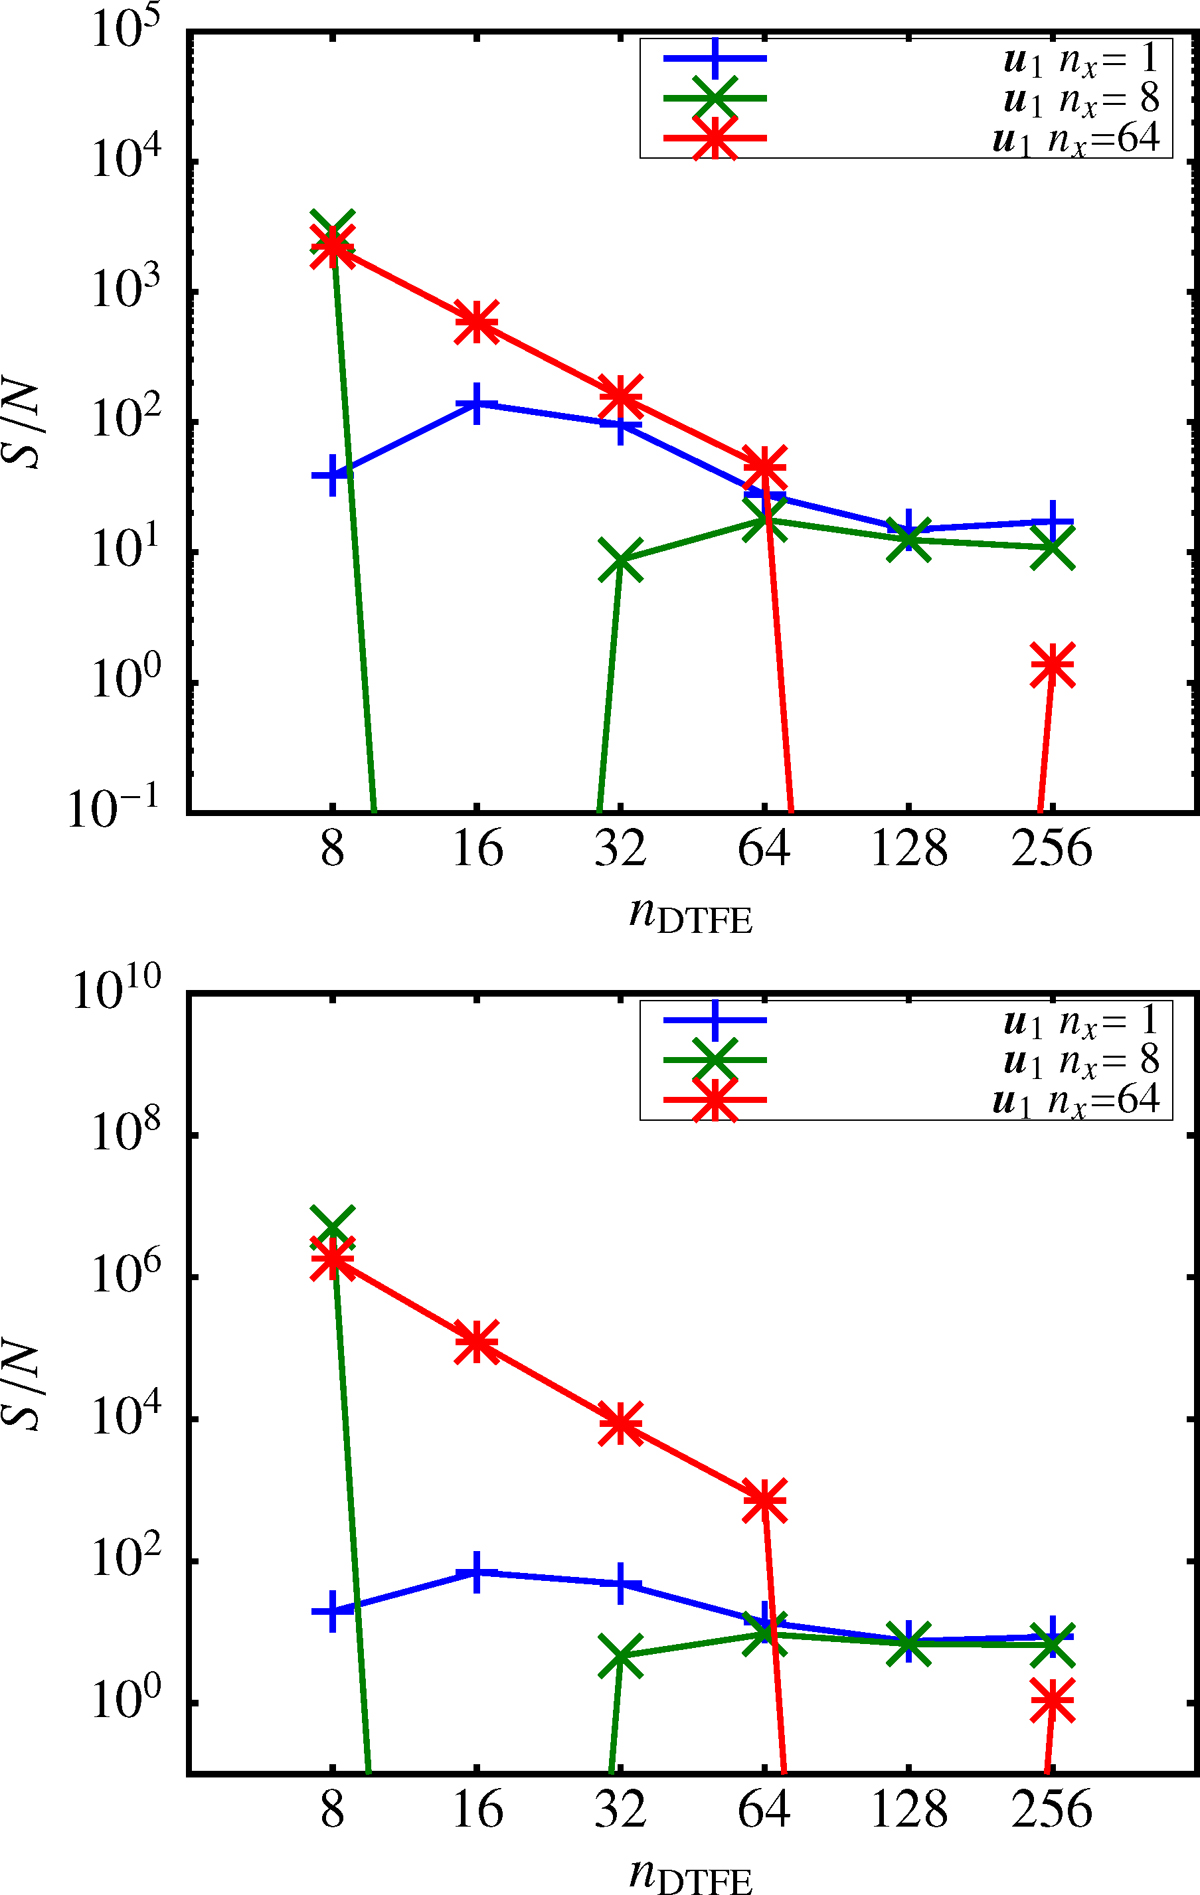
Signal-to-noise ratios S∕N of I (above) and II (below) representing the ratio of rms signal to rms numerical noise σmeas, for analytical model u1 (which has non-zero invariants) in Eq. (13), sampled by realisations of N = 1283 particles drawn from a uniform spatial random distribution for 8 ≤ nDTFE ≤ 64. The signal is negligibly small for nDTFE = 16, 128 for nx = 8, 64, respectively,since the test functions are sinusoidal and in phase with the box.
Current usage metrics show cumulative count of Article Views (full-text article views including HTML views, PDF and ePub downloads, according to the available data) and Abstracts Views on Vision4Press platform.
Data correspond to usage on the plateform after 2015. The current usage metrics is available 48-96 hours after online publication and is updated daily on week days.
Initial download of the metrics may take a while.