| Issue |
A&A
Volume 610, February 2018
|
|
|---|---|---|
| Article Number | A33 | |
| Number of page(s) | 7 | |
| Section | Planets and planetary systems | |
| DOI | https://doi.org/10.1051/0004-6361/201731375 | |
| Published online | 22 February 2018 | |
Did a stellar fly-by shape the planetary system around Pr 0211 in the cluster M44?
1
Max-Planck-Institut für Radioastronomie,
Auf dem Hügel 69,
53121
Bonn,
Germany
e-mail: This email address is being protected from spambots. You need JavaScript enabled to view it.
2
Fresenius University of Applied Sciences,
Platz der Ideen 1,
40476
Düsseldorf,
Germany
3
Max-Planck-Institut für Astronomie,
Königstuhl 17,
69117
Heidelberg,
Germany
Received:
14
June
2017
Accepted:
16
November
2017
Abstract
Aims. Out of the ~3000 exoplanets detected so far, only 14 planets are members of open clusters: one of them is the exoplanet system around Pr 0211 in the cluster M44. The system consists of at least 2 planets, and the outer planet moves on a highly eccentric orbit at 5.5 AU. One hypothesis is that a close fly-by of a neighbouring star was responsible for the eccentric orbit. We test this hypothesis.
Methods. First we determined the type of fly-by that would lead to the observed parameters, and then we used this result to determine the history of such fly-bys in simulations of the early dynamics in an M44-like environment.
Results. We find that although very close fly-bys are required to obtain the observed properties of Pr 0211c, such fly-bys are relatively common as a result of the high stellar density and longevity of the cluster. Such close fly-bys are most frequent during the first 1−2 Myr after cluster formation, corresponding to a cluster age ≤3 Myr. During the first 2 to 3 Myr, about 6.5% of stars experience a fly-by that would lead to such a small system-size as observed for Pr 0211 or even smaller. It is unclear whether planets generally form on such short timescales. However, after this time, the close fly-by rate is still 0.2−0.5 Myr−1, which means that 12−20% of stars would experience such close fly-bys over this time span when we extrapolate the situation to the age of M44.
Conclusions. Our simulations show that the fly-by scenario is a realistic option for the formation of eccentricity orbits of the planets in M44 (Wang et al. 2015). The occurrence of such events is relatively high, leading to the expectation that similar systems are likely common in open clusters in general.
Key words: open clusters and associations: general / protoplanetary disks / planets and satellites: general / planet-star interactions / galaxies: clusters: individual: M44 / methods: numerical
© ESO, 2018
1 Introduction
Although several planets have been detected around stars in clusters, it is still an open question whether planets are as common in clusters as they are around field stars. Out of the ~3000 exoplanets detected so far, only 14 have been discovered in open clusters, and the number of detected planets varies considerably from cluster to cluster. For example, three planets were detected in the Hyades cluster (Sato et al. 2007; Lovis & Mayor 2007; Quinn et al. 2014), five in M44 (Praesepe or NGC 2632; Quinn et al. 2012; Brucalassi et al. 2014; Malavolta et al. 2016; Obermeier et al. 2016), and four in M67 (Brucalassi et al. 2017), while no planets were detected so far in 47 Tucanae (Gilliland et al. 2000; Weldrake et al. 2005), NGC 2301 (Howell et al. 2005), and NGC 7789 (Bramich & Horne 2006) and other investigated clusters (Nascimbeni et al. 2012). The authors therefore interpreted these results in a wide range that extended from “planets are very rare” in clusters to “they are as common around clusters or even more so than they are around field stars”. In addition, the comparatively large radii of some of the planets in the Praesepe, Hyades, and Upper Scorpius clusters indicate systematic differences in their evolutionary states or formation (Obermeier et al. 2016).
The reasons why planets might be less common in open clusters than around field stars are that
disc destruction during the first few Myr could prevent planet formation,
already formed planetary systems could be destroyed in the dense dust environments in the consecutive few Gyr.
Disc destruction can occur either through stellar fly-bys or external photo-evaporation through nearby massive stars. An extensive body of theoretical studies about the influence of these two effects in clusters of various densities exists (Adams et al. 2006; Alexander et al. 2006; Ercolano et al. 2008; Drake et al. 2009; Gorti & Hollenbach 2009; Adams 2010; Dukes & Krumholz 2012; Steinhausen & Pfalzner 2014; Adams & Bloch 2015; Vincke & Pfalzner 2016). It seems that the influence on the frequency of discs and the planetary systems is moderate in relatively short-lived clusters or associations, such as NGC 2024, IC348, or even the Orion nebula cluster (ONC), which are typical for the solar neighbourhood (Malmberg & Davies 2009; Malmberg et al. 2011; Portegies Zwart & Jílková 2015). Nevertheless, the actual properties of the disc and the resulting planetary system might be strongly influenced in these environments (Vincke & Pfalzner 2016). The situation is less clear for long-lived open clusters such as M44. Obviously, in the past these clusters were more compact so that they were able to survive the violent early phase of their development. Young counterparts (<5 Myr) of long-livedopen clusters are, for example, the Arches cluster (Stolte et al. 2010), NGC 3603 (Roman-Lopes et al. 2016)and/or Trumpler 14 (Mesa-Delgado et al. 2016). Recent simulations have tried to determine the fraction of planets that become affected by the cluster environment and either move on an eccentric orbit or become unbound (Hao et al. 2013; Li & Adams 2015). The necessarily very high stellar density means the influence of the environment is much stronger and disc destruction more likely than for the short-lived clusters (Vincke et al. 2015).
Here wewish to concentrate on the exoplanets that have been found in the open cluster M44 (Hénault-Brunet et al. 2012), in particular on the two planets orbiting the star Pr 0211, which is the only planetary system found in a cluster so far. The cluster M44 is located at a distance of 187 pc and has an age of 790 ± 30 Myr as estimatedby isochrone fitting (Brandt & Huang 2015). Of the two planets orbiting the star P 0211, the inner planet has a mass of 1.8 MJup and an orbital period of P = 2.14 day, while the outer planet is more massive (MP0211c ≈ 7.8 MJup; Pfalzner & Kaczmarek 2013), located at a larger distance from the star (aP0211c ≈ 5.5 AU), and on a much more eccentric orbit (e ≈ 0.71) than Pr 0211b (see Table 1).
Two options have been discussed for the origin of the structure of this planetary system:
Pr 0211 might originally have been surrounded by a planetary system with at least three planets, which has experienced a period of chaotic dynamics leading to planet-planet scattering. Eventually, two planets were left on stable inner orbits, while the third planet was ejected from the system. In the following, tidal interaction with the host star circularized the orbit of the inner planet, and it became a hot Jupiter at its current position, while the outer planet stayed on an eccentric and misaligned orbit (Weidenschilling & Marzari 1996; Chatterjee et al. 2008; Nagasawa et al. 2008).
Alternatively, the planetary system experienced a close fly-by of another cluster member. This would have happened before existing additional outer planets would have been stripped away and become unbound, and the orbit of P0221c was excited to this high eccentricity.
Here we concentrate on the second case. Close stellar fly-bys are expected to be frequent in long-lived clusters, at least in the initial stages of cluster evolution, possibly influencing the typical orbital architecture of planets around stars in clusters (Zakamska & Tremaine 2004; Malmberg & Davies 2009). As a consequence, there should be very many systems with a hot Jupiter and a second giant planet on an eccentric outer orbit. First simulations have been reported that tried to determine the expected frequency of such systems (Hao et al. 2013; Li & Adams 2015) in general. Shara et al. (2016) even advocated a cluster origin for several field stars with planetary systems similar to that of Pr 0211.
In contrast to previous work, we here specifically model the situation in M44 and the likelihood of forming a system with the properties found for Pr 0211. In Sect. 2 we describe the numerical method we used to model the cluster dynamics and the effect of fly-bys. In Sect. 3 we discuss which kind of fly-by would lead to the properties that are observed for Pr 0211. Then we show how frequent such events are in a cluster like M44. This is followed by a discussion and summary in Sects. 4 and 5.
Orbital parameters of the two planets orbiting Pr 0211 in M44 (Malavolta et al. 2016).
2 Cluster simulations
We use a two-step approach to model the effect of the cluster surrounding discs and/or planetary systems (DPS), similar to our previous work (Steinhausen & Pfalzner 2014; Vincke et al. 2015; Vincke & Pfalzner 2016). In this approach, we first simulate the cluster dynamics and simultaneously record the fly-by history. Afterwards, the fly-by history is used to determine the effect on the DPS.
2.1 Method
We performed cluster simulations that are representative for M44 using the code Nbody6++GPU (Aarseth 1973, 2003; Spurzem 1999). Our simulations started when the cluster was fully formed, and we assumed that the cluster remained embedded in the gas and dust it formed from for another 1 Myr. This gas was not treated explicitly, but as background potential. For the general cluster simulation parameters, see Table 2. As this investigation is only meant to give an estimate of the frequency ofclose fly-bys, we took neither tidal forces nor stellar evolution into account. In a follow-up study, these effects should be included.
The majority of young clusters disperse their stars within the first 10 Myr and its members become part of the field star population (Lada & Lada 2003; Fall et al. 2009; Dukes & Krumholz 2012; Pfalzner et al. 2015b), only those that were initially quite compact and sufficiently massive survive beyond 10 Myr, and only about 4% survive beyond 100 Myr in the Milky Way (Lada & Lada 2003). Examples of clusters that are currently younger than 10 Myr andare likely to survive beyond 100 Myr are Westerlund 1 and Trumpler 14 (Pfalzner 2013; Andersen et al. 2016).
The density in young clusters changes rapidly within the first 20 Myr after their formation. It can change by several orders of magnitude during this time span, and therefore the current stellar density of M44 is probably not representative of its value in the past. Neither is its mass, because we can expect that M44 lost about half of its members over the past 790 Myr. We therefore assume thatthe cluster initially consisted of about 4000 stars. M44 had its densest phase when it was just a few Myr old.
In simulations the initial cluster density is characterized by the initial half-mass radius, which becomes the key property when simulating the fly-by frequency in the early phases of cluster development. Often the initial half-mass radius is approximated by the radius observed in some selected cluster. Unfortunately, no massive compact cluster has been observed so far that is (nearly) fully formedbut still embedded in its gas. All observed young, massive, compact clusters are basically gas-free so that it is expected that they had even smaller half-mass radii before gas expulsion (Bastian & Goodwin 2006). However, massive compact clusters in the Milky Way that are younger than 20 Myr show sizes that develop in a well-defined specific way (Pfalzner 2009). The combined knowledge of this size evolution and the mass development allows us to determine the initial conditions at the point of gas explusion (Pfalzner 2013). These calculations show that the clusters had sizes in the range 0.1−0.3 pc before they expanded as a result of gas expulsion and stellar ejections. In addition, these calculations show that the star formation efficiency (SFE), that is, the fraction of gas in the cluster that is turned into stars, is much higher for compact clusters (60−80%) than for the clusters in the solar neighbourhood (30%). This high SFE in compact clusters has been confirmed by observation (Rochau et al. 2010; Cottaar et al. 2012). The high SFE means that although the gas expulsion process leads to a portion of its members becoming unbound, the total mass loss is much less dramatic than for the typical clusters in the solar neighbourhood. This is the reason for the long-lasting nature of the cluster. Nevertheless, the cluster expands significantly (by a factor ≈10), but the main reason is the ejection of stars from the densest cluster regions and not gas expulsion (Pfalzner 2013). Therefore we adopted an initial half-mass radius of 0.2 pc and chose the SFE to be 70%.
For the mass distribution in the cluster we chose a modified King profile for the stars and a corresponding Plummer profile for the gas, because this reflects the situation in observed clusters very well (Espinoza et al. 2009; Steinhausen 2013). No primordial binaries were included, as this would have significantly complicated the determination of a fly-by effect on the system. We assumed thesimplest initial conditions, that is, that the cluster is initially in virial equilibrium, no sub-structure, and no mass segregation. The latter two would lead to additional close fly-bys so that the close fly-by frequency found here can be regarded as lower limit (Parker et al. 2015). For a more detailed discussion of the cluster initial conditions, see Vincke et al. (2015).
Another simplification we made is that we only simulated the first 50 Myr of the dynamical evolution of M44. The reason is that these simulations are computationally expensive. We found that the cluster density decreases only slightly after 20 Myr (see Fig. 1, where we show the temporal development of the half-mass radius). This means that the dynamical evolution of the cluster is very slow, and as a consequence, the frequency of close fly-bys remains basically unchanged. However, fly-by frequencies during the early phases <10 Myr strongly depend on the actual setup even for the same parameters, but different seeds. We therefore opted to perform 11 simulations with different seeds for 50 Myr instead of fewer simulations for a longer time span. In this way, we obtained statistically relevant results for the phase when most close fly-bys occur. We did not include stellar evolution either because this is of minor importance during the first 50 Myr. All these effects should be included in future simulations, but as we aim to estimate the likelihood of the planetary system around Pr 0211 being shaped by a fly-by, this simplified treatment suffices. Additional details on the numerical method of the cluster simulation, including a discussion on the approximations, can be found in Vincke & Pfalzner (2017).
Cluster simulation parameters.
2.2 Cluster development
As we show in Sect. 3, the frequency of close fly-bys is highest during the first 10 Myr and remains fairly constant afterwards. The actual frequency can vary considerably from setup to setup (Parker & Meyer 2012). As these types of simulations are generally computationally expensive, we opted for simulating only the first 50 Myr, but performing several simulations to obtain statistically significant results for the important early period. Only for one simulation did we simulate thefull time span. As we did not find a significant deviation from our predictions, this method seems adequate.
Figure 1 shows the development of the cluster half-mass radius over time. The clusters expand from an initial radius of 0.2 pc to about 3 pc over the first 50 Myr. As most clusters older than 100 Myr in the Milky Way typically have half-mass radii in the range 2−3 pc, this seems arealistic representation of the development of M44. If anything, the cluster expands too little because including binaries andstellar evolution that were not included here could lead to additional cluster expansion. This means that again the fly-by frequency at older ages is underestimated and not overestimated. The following results should therefore be regarded as lower limits of the occurrence of such close fly-bys.
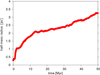 |
Fig. 1 Temporal development of the half-mass radius of the simulated M44-like cluster. The result is obtain by averaging over 11 different realizations of this cluster. |
3 Effect on the system size and eccentricity
3.1 Method
After the cluster simulations were performed, the recorded fly-by history was used to determine the effect on the DPS. Here we applied the results from our previous studies of the fly-by effects on discs sizes, where we neglected viscous forces and self-gravity within the disc (Pfalzner et al. 2005). This also means that we neglected the effect of viscous spreading in the discs. The disc size therefore remains constant throughout our simulations, unless it is altered by a consecutive fly-by (cf. Rosotti et al. 2014). However, neglecting viscosity has the advantage that the same method can be applied in the protoplanetary disc phase as in the planetary system phase. Another advantage is that existing studies cover a very wide parameter space for fly-bys that we can use.
It was assumed that each star was initially surrounded by a protoplanetary disc of 200 AU (Williams & Cieza 2011), and an equivalent size was anticipated for the potentially existing planetary system. This value is motivated by the fact that in Taurus, aprototype of a sparsely populated region, the disc size distribution peaks at 200 AU (Andrews & Williams 2007). This should be representative for systems that have not been processed by their surroundings. Similar direct observations of planetary systems with planets on wide orbits mainly show periastra in the range of 100−200 AU (McCaughrean & O’dell 1996; Eisner et al. 2008; Bally et al. 2015). In Sect. 3 we show that the majority of discs or planetary systems in M44 were stripped to sizes well below 100 AU, so the result hardly depends on the initial disc-size choice. The likely high stellar density in M44 means that the disc size might have been altered not only by stellar fly-bys, but also by photo-evaporation during the early phases. This has not been taken into account here, but should be considered in a follow-up study.
When recording the fly-by history, we only took events into account that reduced the disc size by at least 5% (rdisc∕rprevious ≤ 0.95), because this is generally the error range of the parameter studies we used. Another simplification is that the mass transport from the perturber was neglected. The reason is that captured matter is usually deposited very close to the star and does not influence the disc size as such (Pfalzner et al. 2005).
3.2 Results
The general effect of a fly-by on a disc is that some particles remain unaffected, others acquire sub- or super-Keplerian velocities and move onto different orbits, some become unbound, and a fraction might even become bound to the perturbing star. Here we concentrate on the matter that remains bound to the host star. The matter that remains unaffected is mainly close to it and remains on fairly circular orbits, and Pr 0211b could be an example for a planet in this region. Matter at larger distances from the host is more effected by the perturber, and it is often propelled onto highly eccentric orbits. Breslau et al. (2015) have shown that the central unperturbed area mainly determines the disc size and therefore the planetary system size. There is only a narrow transition area where considerable amount of matter still is on eccentric orbits, whereas outside this area, relatively little mass is spread out, with a few particles moving on highly eccentric orbits. The latter is similar to our Kuiper belt or the transneptunian objects in general. The relative location of these areas strongly depends on the actual fly-by parameters.
How can we apply this knowledge to determine a possible fly-by scenario for Pr 0211? The outer planet Pr 0211c would have to belong to the transition area, between the part of the DPS that remains unperturbed and the part that becomes unbound as a result of the fly-by. It is often assumed that the fate of matter in the DPS after the fly-by is simply a function of its distance to the central star. This is a crude over-simplification. The actual orbital development of the disc material or planet is not only a question of the periastron distance of the perturber passage, but also of the mass ratio between the two stars involved, and most importantly, it sensitively depends on the relative position at periastron passage. This is illustrated by Fig. 2, which shows the eccentricity of matter after the fly-by as a function of the projected position at periastron distance (for additional information on this type of representation, see Breslau et al. 2017).
Pr 0211c has a semi-major axis of 5.5 AU and moves on a highly eccentric orbit. This means that the inner unperturbed area cannot exceed ≈6 AU and is probably even smaller. It is obvious that only very close fly-bys will lead to system sizes smaller than 6 AU. How close the fly-by had to be to lead to such a small system size depends on the mass ratio between the star and the perturber and on the inclination of the orbit. To obtain an idea for the envisaged parameter space, we first only considered coplanar fly-bys. In this case, the following relation
  holds (Breslau et al. 2014), where m12 is the ratio between the mass of the perturber and that of the host star and rperi is the periastron distance of the fly-by.With rd = 6 AU, this leads to a periastron distance of
 (1)
(1)
If the perturber was of equal mass as Pr 0211, it would have had to pass at ≈20 AU or closer to lead to such a small system. Figure 3 shows the region in mass-radius plane where fly-bys would lead to such small system sizes.
It can be expected that the fly-by in many cases would be not coplanar, but move on an inclined orbit. Then the effect on the disc size is smaller, and the fly-by would have needed to be even closer to result in rd < 6 AU. Bhandare et al. (2016) and Vincke & Pfalzner (2017) reported two different approximation for an inclination-angle-averaged disc size after a fly-by. Here we used the formula given by Vincke & Pfalzner (2017), which leads to the following formula for the necessary periastron distance,
 (2)
(2)
The relevant parameter space is also illustrated in Fig. 3 by the shaded area.
Returning to Fig. 2, this shows the actual orbital development of the disc matter for a coplanar fly-by of an equal-mass perturbrt (m12 = 1) that leads to a disc size of 6 AU. Figure 2a shows the orbital development of all particles in the DPS. The colours indicate the eccentricity of the DPS matter after the fly-by, where the blue areas show matter that remains mainly unperturbed by the fly-by, while matter in the grey areas would become unbound or even captured by the perturber. All other matter would be bound on eccentric orbits. Figure 2a illustrates that most of the DPS is lost in such a close fly-by and mostly matter very close to the star remains bound. However, in contrast to the commonly held view, a small fraction of matter belonging to the outer parts of the disc does remain bound. In Fig. 2b the central part is shown as a zoom-in. Here matter with eccentricities similar to that of Pr 0211c are of special interest; this matter is shown in light brown. For this particular case of an equal-mass coplanar encounter, it is a relatively well defined area where this type of eccentricity is induced. For inclined fly-bys and different m12, the location in the original disc can considerably differ. Figure 2c shows the eccentricity vs. the semi-mayor axis of the matter after the fly-by for the co-planar case. Some of the matter lies in the parameter space relevant for Pr 0211. For slightly closer fly-bys we would obtain a better match to the properties of Pr 0211c, but we only attempted an estimate of the frequency of such events, therefore the determined parameters suffice.
In our cluster simulations of M44, all fly-bys that fulfilled the criterion given by Eq. (2) were tracked. Figure 4 shows the cumulative number of fly-bys that led to rd < 6 AUas a function of time since cluster formation. We note that this time is not identical to cluster age as the cluster requires 0.5−2 Myr to form. Thus to translate the time given here into cluster age, we would have to add the formation time. In Fig. 4 the horizontal line indicates the time of gas expulsion (here 1 Myr). The number of fly-bys that lead to such small system sizes is highest during the embedded phase, as expected. This is so because the stellar density is highest during that phase. During this phase, about 260 systems are cut down to such a small size. This means that during the embedded phase, ≈6.5% of all discs or planetary systems are reduced to sizes of 6 AU or smaller in a cluster like M44.
During this embedded phase, the cluster expansion is only driven by the loss of stars that are kicked out as a result of close fly-bys. For long-lived clusters, gas expulsion is less significant than for the initially more common extended associations, as only ≈30% of the total mass is lost. Therefore, gas expulsion brings the cluster out of equilibrium, but relatively few stars become unbound. Nevertheless, in order to find a new equilibrium state, the cluster reacts with considerable expansion, which leads to a drop in stellar density. As a result, the close fly-by rate decreases significantly. Figure 4 shows that the close fly-by rate after gas expulsion is only about 10% of its value before gas expulsion. The cluster relatively quickly (10 Myr) recovers a new (quasi-) equilibrium state, and afterwards, the close fly-by rate remains more or less constant at 0.2−0.5 Myr−1. When we extrapolate this to the current age of M44, we would expect 12−20% of stars in M44 to have DPS sizes smaller than 6 AU as a result of fly-bys. This value is probably somewhat on the high side because the cluster will experience stellar evolution and binary interactions, which were not included in this study. However, the fly-by rate will not decrease by more than a factor of two over the following 780 Myr.
Can we say anything about the typical fly-by that leads to a system similar to that around Pr 0211? Figure 5 shows the typical parameters of close fly-bys in our simulations. As expected, such destructive fly-bys mostly occur close to the cluster centre where the stellar density is highest, more specifically, in the central 0.1 pc of the cluster (see Fig. 5a). The vastmajority of fly-bys occurs on nearly parabolic orbits (Fig. 5b), which means that our assumption of a parabolic encounter, when calculating the resulting disc size, was justified. This is similar to the situation in more extended clusters or associations typical for the solar neighbourhood (Olczak et al. 2010). In contrast, we find that in more massive likely long-lived clusters such as NGC 3603, where the stellar denisty is even higher, hyperbolic encounters are more common (Olczak et al. 2012). Very little can be said about the likely mass of the perturber star because the mass-ratio distribution is relatively broad (Fig. 5c). There are two peaks, one at around 1−2 and one at high mass ratios, but in between, the distribution is relatively flat. By contrast, the periastron range is well defined, with a peak around 20 AU.
Figure 6 shows the distribution of disc sizes at 50 Myr of cluster development. The bin with DPS sizes <10 AU is the most populated. About 13.5% of the stars have a disc size <10 AU at 50 Myr. This means that such small system sizes are very common. More than 26% are smaller than 30 AU, which is the size of our solar system (Pfalzner et al. 2015a), and virtually all DPS are affected by the cluster environment of M44. This means in general that the DPS should on average be much smaller than those of the field stars.
In summary, a fly-by at a distance of ≈20 AU on a parabolic orbit when Pr 0211 was close to the cluster centre is the most likely scenario.
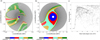 |
Fig. 2 Matter development in the DPS after a fly-by shown for the typical case of a 20 AU periastron distance. The stars were of equal mass, and the orbit was parabolic and coplanar. The colour indicates the eccentricity after the fly-by. The position of the matter corresponds to that if the star would have remained unperturbed, but at the time of periastron passage. Panel a: particle development in the entire disc. Panel b: zoom-in onto the relevant area. Panel c: final eccentricity as a function of the final semi-major axis. |
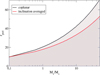 |
Fig. 3 Parameter space where stellar fly-bys lead to DPS sizes of 6 AU or smaller. The black line shows the case of a coplanar event, and the red line the case when it is averaged over all possible orientations between the plane of the DPS and the fly-by plane. In both cases, a parabolic orbit was assumed. |
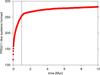 |
Fig. 4 Cumulative number of encounters that lead to a system size smaller than 6 AU as a function of time since cluster formation. The horizontal line at 1 Myr indicates the assumed time of the gas expulsion. |
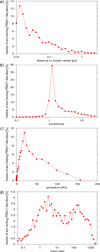 |
Fig. 5 Fraction of fly-bys that lead to a system size smaller than 6 AU as a function of a) distance to cluster centre, b) eccentricity, c) periastron distance, and d) mass ratio between the two stars involved in the fly-by. |
4 Application to other clusters and cluster properties
The question arises to which extent the results we presented here for M44 can be generalized to other long-lived clusters. Generally, planetary systems in long-lived clusters will be relatively small, which means that planets with rP > 10 AU will be quite rare. As a result of fly-bys, the outer planets of such systems will often be on fairly eccentric orbits. M44 is on the low-mass end of long-lived clusters, in more massive and therefore denser clusters, the influence of close fly-bys will be even more pronounced. Thus we can expect that the average system size will decrease with increasing cluster mass. Thus if Westerlund 1 really develops into a long-lived cluster, its planetary systems can be expected to be even smaller than those in M44.
We discussed the possibility that the orbit of Pr 0221c might have been caused by the effect of a fly-by on the disc around Pr 0221. Another alternative to this scenario would be that Pr 0211c was captured from the star that flew past. It has been shown that such events are not unlikely for planets or dwarf planets on wider orbits in less dense clusters (Jílková et al. 2015). Given the above results, the capture scenario would not be far fetched for the Pr 0211 system. As capture requires approximately the same periastron distance range as the case discussed here; this would require a detailed study of which of the two processes is the more likely.
In principle, our results could also be used to give an estimate on the number of free-floating planets in M44 (Wang et al. 2015). Pacucci et al. (2013) estimated that 26% of stars in the cluster could have lost their planets. We took our solar system as a template, that is, a Jupiter-sized planet at 5 AU, a Uranus-sized planet at 20 AU, and a Neptun-sized planet at 30 AU. This might not be the best choice because exoplanet research has shown that many systems exisst that differ significantly from our own solar system, but it is the only system for which we are sure that we know the full extent of massive planets. Using our results, we would expect that M44 contains 160−360 free-floating Jupiters, plus 200−600 free-floating Uranuses and an additional 220−800 free-floating Neptunes.
5 Summary and conclusion
The exoplanet system around Pr 0211 in the cluster M44 consists of at least two planets, and the outer planet moves on a highly eccentric orbit. Here we tested the hypothesis that a close fly-by of a neighbouring star might be responsible for the eccentric orbit of the second planet by performing a simulation of the cluster dynamics. We determined the fly-by frequency that would lead to systems equivalent to that around Pr 0211. We found that such close fly-bys are most common during the initial 2−3 Myr after cluster formation. During that time span, about 6.5% of all stars in the cluster would experience a fly-by that would lead to a system size of 6 AU or smaller. However, given the uncertainty in the planet formation duration, planets might not have finshed their formation at that time. Thus the fly-by would possibly have needed to take place at later times. However, although the frequency ofsuch fly-bys significantly decreases as a result of cluster expansion after gas expulsion, this does not mean that such a fly-by could not have happened at later times. The reason is that the fly-by frequency later remains more or less constant at 0.2−0.5 Myr−1. If we extrapolate this to the current age of M44 – 790 Myr, we can expect another 6−14% of stars to experience such a close fly-by. In other words, it is equally likely that the such a fly-by occurred during the first 5 Myr as later on. In total, we would therefore expect 12−20% to have undergone a close fly-by. We can conclude that although this is not definite proof that the high eccentricity of Pr 0211c was caused by a close fly-by, it makes a fly-by a convincing option that has to be seriously considered.
Our simulations show that small system sizes can be expected to be very common in M44. About 14% of the stars are expected to have planetary systems smaller than 10 AU and 27% to have systems smaller than our solar system (30 AU) as a result of stellar fly-bys. These figures are a lower limit because other effects such as external photo-evaporation can lead to an additional reduction of disc sizes during the formation phase. In more massive compact clusters, for example, NGC 3603, the influence of stellar fly-bys would be even stronger, so that planetary systems such as that around Pr 0211 are expected to be very common there.
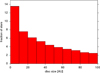 |
Fig. 6 Distribution of DPS sizes after 50 Myr of cluster development. |
References
- Aarseth, S. J. 1973, Vistas in Astronomy, 15, 13 [NASA ADS] [CrossRef] [Google Scholar]
- Aarseth, S. J. 2003, in Gravitational N-Body Simulations, ed. refgn J. Aarseth Sverre (Cambridge, UK: Cambridge University Press), 430 [Google Scholar]
- Adams, F. C. 2010, ARA&A, 48, 47 [NASA ADS] [CrossRef] [Google Scholar]
- Adams, F. C., & Bloch, A. M. 2015, MNRAS, 446, 3676 [NASA ADS] [CrossRef] [Google Scholar]
- Adams, F. C., Proszkow, E. M., Fatuzzo, M., & Myers, P. C. 2006, ApJ, 641, 504 [NASA ADS] [CrossRef] [Google Scholar]
- Alexander, R. D., Clarke, C. J., & Pringle, J. E. 2006, MNRAS, 369, 229 [NASA ADS] [CrossRef] [Google Scholar]
- Andersen, M., Gennaro, M., Brandner, W., et al. 2016, A&A, 602, A22 [Google Scholar]
- Andrews, S. M., & Williams, J. P. 2007, ApJ, 659, 705 [NASA ADS] [CrossRef] [Google Scholar]
- Bally, J., Mann, R. K., Eisner, J., et al. 2015, ApJ, 808, 69 [NASA ADS] [CrossRef] [Google Scholar]
- Bastian, N., & Goodwin, S. P. 2006, MNRAS, 369, L9 [NASA ADS] [CrossRef] [Google Scholar]
- Bhandare, A., Breslau, A., & Pfalzner, S. 2016, A&A, 594, A53 [NASA ADS] [CrossRef] [EDP Sciences] [Google Scholar]
- Bramich, D. M., & Horne, K. 2006, MNRAS, 367, 1677 [NASA ADS] [CrossRef] [Google Scholar]
- Brandt, T. D., & Huang, C. X. 2015, ApJ, 807, 24 [NASA ADS] [CrossRef] [Google Scholar]
- Breslau, A., Steinhausen, M., Vincke, K., & Pfalzner, S. 2014, A&A, 565, A130 [NASA ADS] [CrossRef] [EDP Sciences] [Google Scholar]
- Breslau, A., Vincke, K., & Pfalzner, S. 2017, A&A, 599, A91 [NASA ADS] [CrossRef] [EDP Sciences] [Google Scholar]
- Brucalassi, A., Pasquini, L., Saglia, R., et al. 2014, A&A, 561, L9 [NASA ADS] [CrossRef] [EDP Sciences] [Google Scholar]
- Brucalassi, A., Koppenhoefer, J., Saglia, R., et al. 2017, A&A, 603, A85 [NASA ADS] [CrossRef] [EDP Sciences] [Google Scholar]
- Chatterjee, S., Ford, E. B., Matsumura, S., & Rasio, F. A. 2008, ApJ, 686, 580 [NASA ADS] [CrossRef] [Google Scholar]
- Cottaar, M., Meyer, M. R., Andersen, M., & Espinoza, P. 2012, A&A, 539, A5 [NASA ADS] [CrossRef] [EDP Sciences] [Google Scholar]
- Drake, J. J., Ercolano, B., Flaccomio, E., & Micela, G. 2009, ApJ, 699, L35 [NASA ADS] [CrossRef] [Google Scholar]
- Dukes, D., & Krumholz, M. R. 2012, ApJ, 754, 56 [NASA ADS] [CrossRef] [Google Scholar]
- Eisner, J. A., Plambeck, R. L., Carpenter, J. M., et al. 2008, ApJ, 683, 304 [NASA ADS] [CrossRef] [Google Scholar]
- Ercolano, B., Drake, J. J., Raymond, J. C., & Clarke, C. C. 2008, ApJ, 688, 398 [NASA ADS] [CrossRef] [Google Scholar]
- Espinoza, P., Selman, F. J., & Melnick, J. 2009, A&A, 501, 563 [NASA ADS] [CrossRef] [EDP Sciences] [Google Scholar]
- Fall, S. M., Chandar, R., & Whitmore, B. C. 2009, ApJ, 704, 453 [NASA ADS] [CrossRef] [Google Scholar]
- Gilliland, R. L., Brown, T. M., Guhathakurta, P., et al. 2000, ApJ, 545, L47 [NASA ADS] [CrossRef] [Google Scholar]
- Gorti, U., & Hollenbach, D. 2009, ApJ, 690, 1539 [Google Scholar]
- Hao, W., Kouwenhoven, M. B. N., & Spurzem, R. 2013, MNRAS, 433, 867 [NASA ADS] [CrossRef] [Google Scholar]
- Hénault-Brunet, V., Evans, C. J., Sana, H., et al. 2012, A&A, 546, A73 [NASA ADS] [CrossRef] [EDP Sciences] [Google Scholar]
- Howell, S. B., VanOutryve, C., Tonry, J. L., Everett, M. E., & Schneider, R. 2005, PASP, 117, 1187 [NASA ADS] [CrossRef] [Google Scholar]
- Jílková, L., Portegies Zwart, S., Pijloo, T., & Hammer, M. 2015, MNRAS, 453, 3157 [Google Scholar]
- Lada, C. J., & Lada, E. A. 2003, ARA&A, 41, 57 [NASA ADS] [CrossRef] [Google Scholar]
- Li, G., & Adams, F. C. 2015, MNRAS, 448, 344 [NASA ADS] [CrossRef] [Google Scholar]
- Lovis, C., & Mayor, M. 2007, A&A, 472, 657 [NASA ADS] [CrossRef] [EDP Sciences] [Google Scholar]
- Malavolta, L., Nascimbeni, V., Piotto, G., et al. 2016, A&A, 588, A118 [NASA ADS] [CrossRef] [EDP Sciences] [Google Scholar]
- Malmberg, D.,& Davies, M. B. 2009, MNRAS, 394, L26 [NASA ADS] [CrossRef] [Google Scholar]
- Malmberg, D., Davies, M. B., & Heggie, D. C. 2011, MNRAS, 411, 859 [NASA ADS] [CrossRef] [Google Scholar]
- McCaughrean,M. J., & O’dell, C. R. 1996, AJ, 111, 1977 [NASA ADS] [CrossRef] [Google Scholar]
- Mesa-Delgado,A., Zapata, L., Henney, W. J., Puzia, T. H., & Tsamis, Y. G. 2016, ApJ, 825, L16 [NASA ADS] [CrossRef] [Google Scholar]
- Nagasawa, M., Ida, S., & Bessho, T. 2008, ApJ, 678, 498 [NASA ADS] [CrossRef] [Google Scholar]
- Nascimbeni, V., Bedin, L. R., Piotto, G., De Marchi, F., & Rich, R. M. 2012, A&A, 541, A144 [NASA ADS] [CrossRef] [EDP Sciences] [Google Scholar]
- Obermeier, C., Henning, T., Schlieder, J. E., et al. 2016, AJ, 152, 223 [NASA ADS] [CrossRef] [Google Scholar]
- Olczak, C., Pfalzner, S., & Eckart, A. 2010, A&A, 509, A63 [NASA ADS] [CrossRef] [EDP Sciences] [Google Scholar]
- Olczak, C., Kaczmarek, T., Harfst, S., Pfalzner, S., & Portegies Zwart S. 2012, ApJ, 756, 123 [NASA ADS] [CrossRef] [Google Scholar]
- Pacucci, F., Ferrara, A., & D’Onghia, E. 2013, ApJ, 778, L42 [NASA ADS] [CrossRef] [Google Scholar]
- Parker, R. J., & Meyer, M. R. 2012, MNRAS, 427, 637 [Google Scholar]
- Parker, R. J., Dale, J. E., & Ercolano, B. 2015, MNRAS, 446, 4278 [NASA ADS] [CrossRef] [Google Scholar]
- Pfalzner, S. 2009, A&A, 498, L37 [NASA ADS] [CrossRef] [EDP Sciences] [Google Scholar]
- Pfalzner, S. 2013, A&A, 549, A82 [NASA ADS] [CrossRef] [EDP Sciences] [Google Scholar]
- Pfalzner, S., & Kaczmarek, T. 2013, A&A, 559, A38 [NASA ADS] [CrossRef] [EDP Sciences] [Google Scholar]
- Pfalzner, S., Umbreit, S., & Henning, T. 2005, ApJ, 629, 526 [NASA ADS] [CrossRef] [Google Scholar]
- Pfalzner, S., Davies, M. B., Gounelle, M., et al. 2015a, Phys. Scripta, 90, 068001 [NASA ADS] [CrossRef] [Google Scholar]
- Pfalzner, S., Vincke, K., & Xiang, M. 2015b A&A, 576, A28 [NASA ADS] [CrossRef] [EDP Sciences] [Google Scholar]
- Porras, A., Christopher, M., Allen, L., et al. 2003, AJ, 126, 1916 [NASA ADS] [CrossRef] [Google Scholar]
- Portegies Zwart, S. F., & Jílková, L. 2015, MNRAS, 451, 144 [NASA ADS] [CrossRef] [Google Scholar]
- Quinn, S. N., White, R. J., Latham, D. W., et al. 2012, ApJ, 756, L33 [NASA ADS] [CrossRef] [Google Scholar]
- Quinn, S. N., White, R. J., Latham, D. W., et al. 2014, ApJ, 787, 27 [NASA ADS] [CrossRef] [Google Scholar]
- Rochau, B., Brandner, W., Stolte, A., et al. 2010, ApJ, 716, L90 [NASA ADS] [CrossRef] [Google Scholar]
- Roman-Lopes, A., Franco, G. A. P., & Sanmartim, D. 2016, ApJ, 823, 96 [NASA ADS] [CrossRef] [Google Scholar]
- Rosotti, G. P., Dale, J. E., de Juan Ovelar, M., et al. 2014, MNRAS, 441, 2094 [NASA ADS] [CrossRef] [Google Scholar]
- Sato, B., Izumiura, H., Toyota, E., et al. 2007, ApJ, 661, 527 [NASA ADS] [CrossRef] [Google Scholar]
- Shara, M. M., Hurley, J. R., & Mardling, R. A. 2016, ApJ, 816, 59 [NASA ADS] [CrossRef] [Google Scholar]
- Spurzem, R. 1999, J. Comput. Appl. Math., 109, 407 [NASA ADS] [CrossRef] [Google Scholar]
- Steinhausen, M., & Pfalzner, S. 2014, A&A, 565, A32 [NASA ADS] [CrossRef] [EDP Sciences] [Google Scholar]
- Stolte, A., Morris, M. R., Ghez, A. M., et al. 2010, ApJ, 718, 810 [NASA ADS] [CrossRef] [Google Scholar]
- Vincke, K., & Pfalzner, S. 2016, ApJ, 828, 48 [NASA ADS] [CrossRef] [Google Scholar]
- Vincke, K., Breslau, A., & Pfalzner, S. 2015, A&A, 577, A115 [NASA ADS] [CrossRef] [EDP Sciences] [Google Scholar]
- Wang, L., Kouwenhoven, M. B. N., Zheng, X., Church, R. P., & Davies, M. B. 2015, MNRAS, 449, 3543 [NASA ADS] [CrossRef] [Google Scholar]
- Weidenschilling, S. J., & Marzari, F. 1996, Nature, 384, 619 [NASA ADS] [CrossRef] [PubMed] [Google Scholar]
- Weldrake, D. T. F., Sackett, P. D., Bridges, T. J., & Freeman, K. C. 2005, ApJ, 620, 1043 [NASA ADS] [CrossRef] [Google Scholar]
- Williams, J. P., & Cieza, L. A. 2011, ARA&A, 49, 67 [NASA ADS] [CrossRef] [Google Scholar]
- Zakamska, N. L., & Tremaine, S. 2004, AJ, 128, 869 [NASA ADS] [CrossRef] [Google Scholar]
All Tables
Orbital parameters of the two planets orbiting Pr 0211 in M44 (Malavolta et al. 2016).
All Figures
|
Fig. 1 Temporal development of the half-mass radius of the simulated M44-like cluster. The result is obtain by averaging over 11 different realizations of this cluster. |
| In the text | |
|
Fig. 2 Matter development in the DPS after a fly-by shown for the typical case of a 20 AU periastron distance. The stars were of equal mass, and the orbit was parabolic and coplanar. The colour indicates the eccentricity after the fly-by. The position of the matter corresponds to that if the star would have remained unperturbed, but at the time of periastron passage. Panel a: particle development in the entire disc. Panel b: zoom-in onto the relevant area. Panel c: final eccentricity as a function of the final semi-major axis. |
| In the text | |
|
Fig. 3 Parameter space where stellar fly-bys lead to DPS sizes of 6 AU or smaller. The black line shows the case of a coplanar event, and the red line the case when it is averaged over all possible orientations between the plane of the DPS and the fly-by plane. In both cases, a parabolic orbit was assumed. |
| In the text | |
|
Fig. 4 Cumulative number of encounters that lead to a system size smaller than 6 AU as a function of time since cluster formation. The horizontal line at 1 Myr indicates the assumed time of the gas expulsion. |
| In the text | |
|
Fig. 5 Fraction of fly-bys that lead to a system size smaller than 6 AU as a function of a) distance to cluster centre, b) eccentricity, c) periastron distance, and d) mass ratio between the two stars involved in the fly-by. |
| In the text | |
|
Fig. 6 Distribution of DPS sizes after 50 Myr of cluster development. |
| In the text | |
Current usage metrics show cumulative count of Article Views (full-text article views including HTML views, PDF and ePub downloads, according to the available data) and Abstracts Views on Vision4Press platform.
Data correspond to usage on the plateform after 2015. The current usage metrics is available 48-96 hours after online publication and is updated daily on week days.
Initial download of the metrics may take a while.