Free Access
Fig. 9
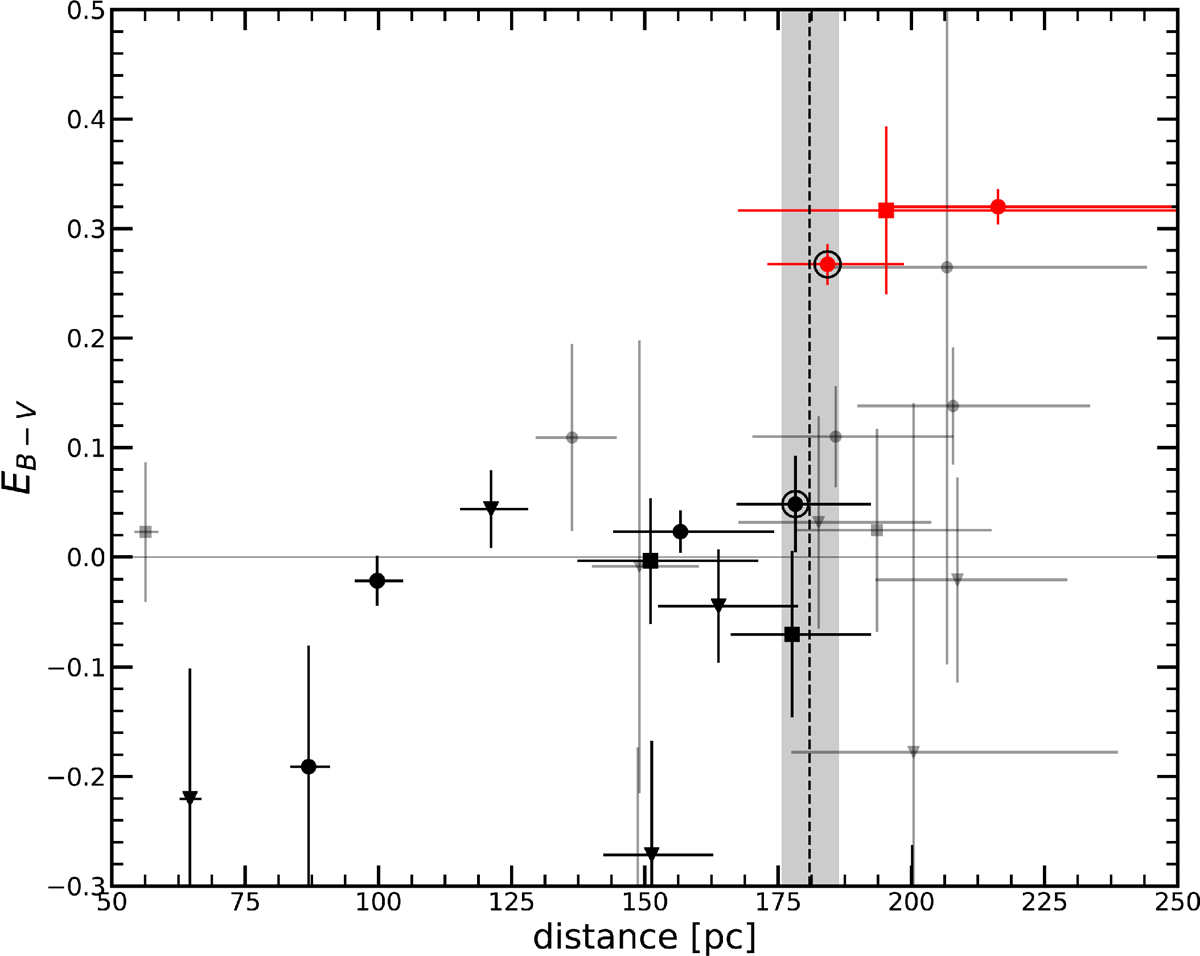
Color excess as a function of distance for stars included in the TGAS catalog and located on the line of sight of the Chamaeleon II cloud. The dashed line represents the position of the cloud front edge, and the gray shaded region its uncertainty. Other symbols are as in Fig. 6.
Current usage metrics show cumulative count of Article Views (full-text article views including HTML views, PDF and ePub downloads, according to the available data) and Abstracts Views on Vision4Press platform.
Data correspond to usage on the plateform after 2015. The current usage metrics is available 48-96 hours after online publication and is updated daily on week days.
Initial download of the metrics may take a while.