Fig. 6
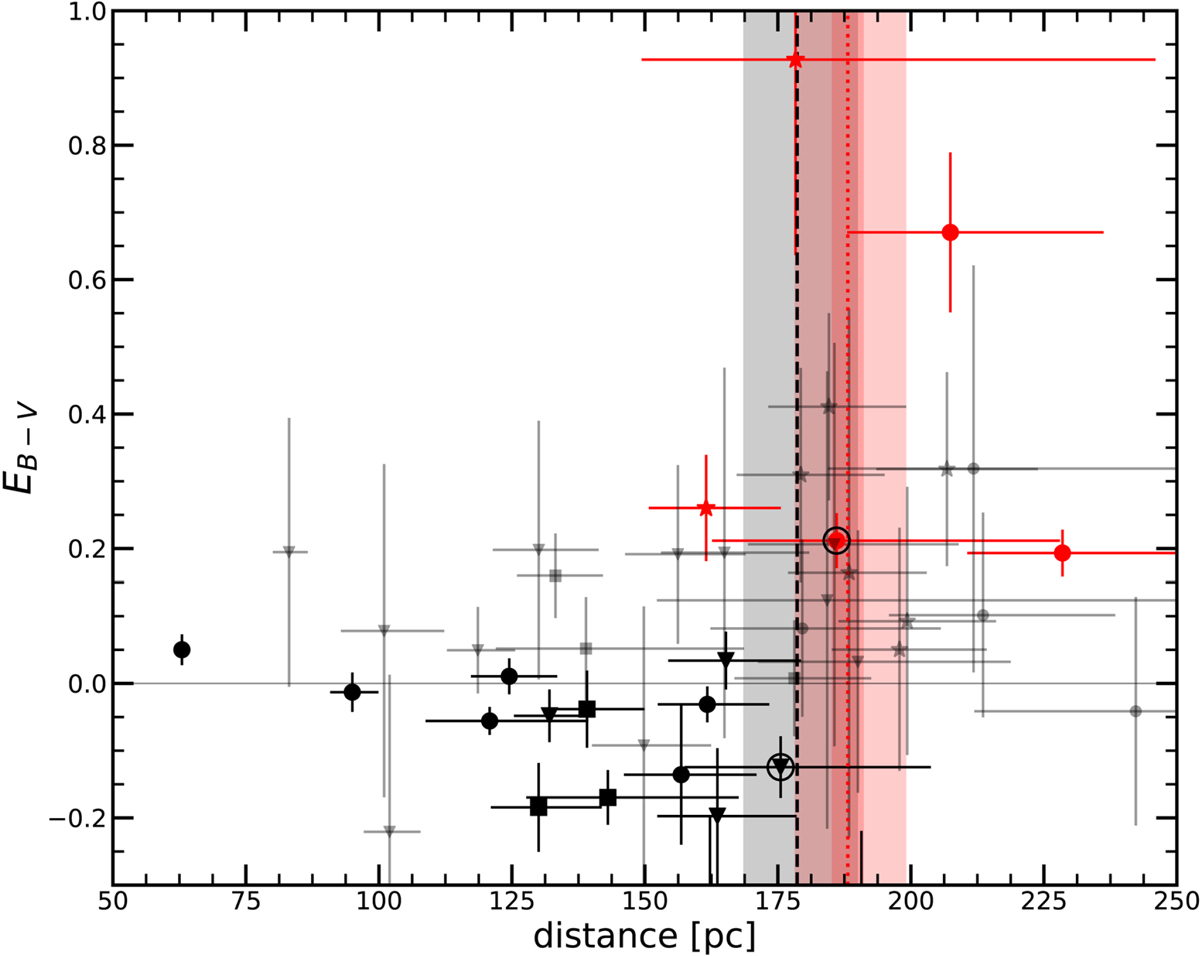
Extinction distribution along the line of sight for stars located on the line of sight of the Chamaeleon I cloud. The dashed line represents the position of the front edge of the cloud determined by the reddening turn-on method and the gray shaded region its 1σ uncertainty. The red dotted line indicates the average distance of the members, shown here for comparison, and the red shaded region indicates the 1σ uncertainty on this value, either statistical (darker red region) or systematic (lighter red region). The members of the Chamaeleon I region are represented with stars, the field stars for which both the spectral type and luminosity class are reported in the literature are shown with circles, whereas triangles indicate objects for which we estimate the luminosity class ourselves. Symbols colored in red indicate the stars with color excess larger than 0 at 3σ, in black withcolor excess <0.2, and those in gray indicate the uncertainties too large to be considered in either of these two categories. We highlight with black circles the stars used to compute the distance of the reddening turn-on, thus the front edge of the cloud.
Current usage metrics show cumulative count of Article Views (full-text article views including HTML views, PDF and ePub downloads, according to the available data) and Abstracts Views on Vision4Press platform.
Data correspond to usage on the plateform after 2015. The current usage metrics is available 48-96 hours after online publication and is updated daily on week days.
Initial download of the metrics may take a while.