Fig. 4
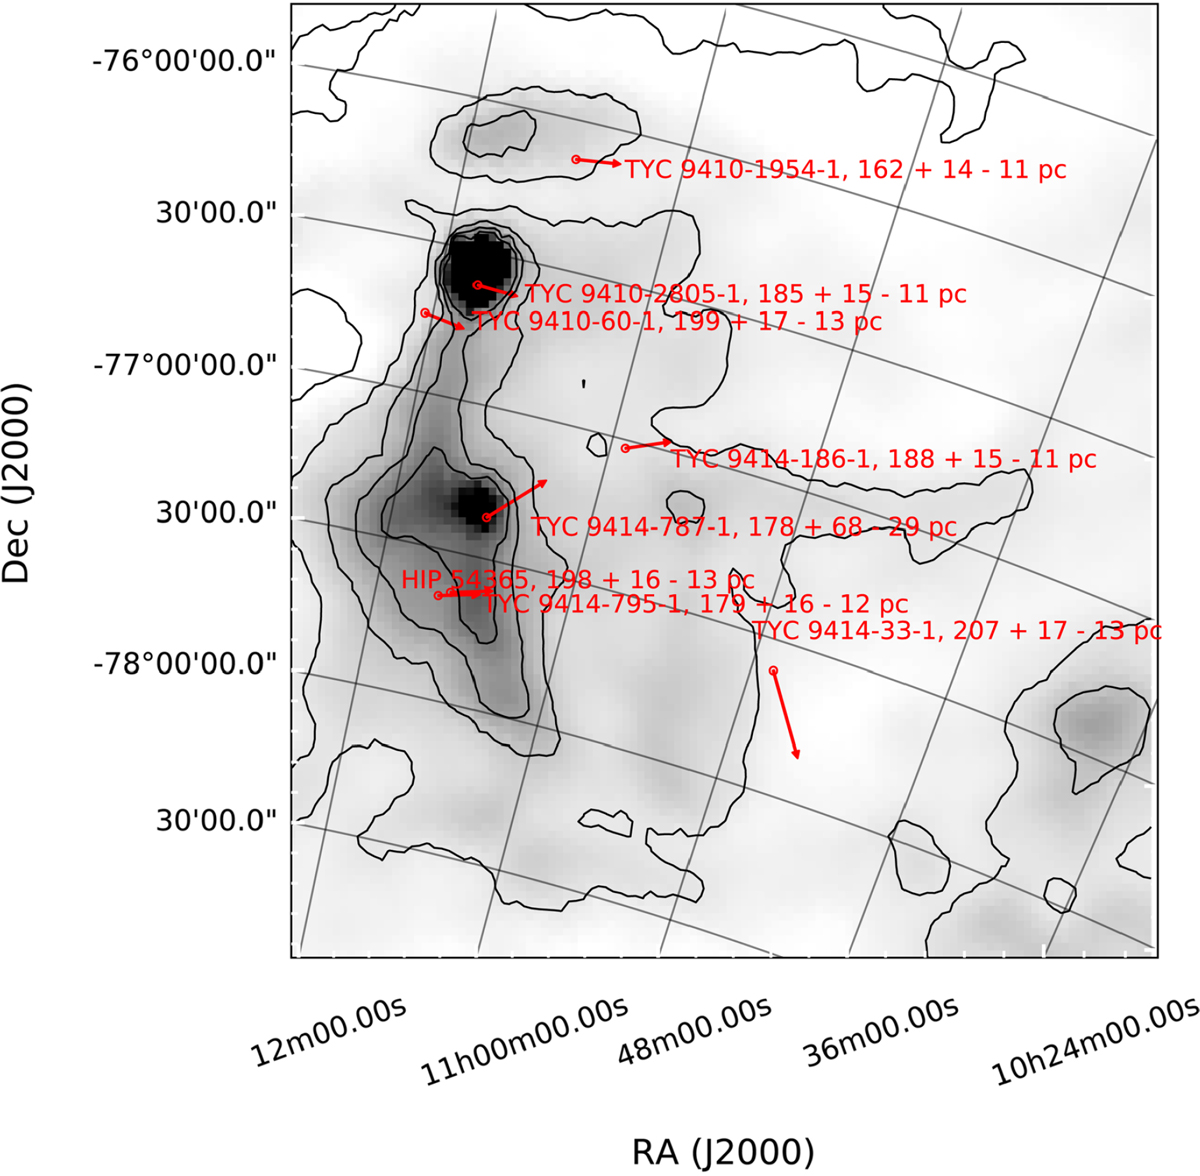
IRAS maps of the Chamaeleon I region at 100 μm (Schlegel et al. 1998). The six contours range from 8 MJy/sr to 30 MJy/sr. The positions of the members of this region included in the TGAS catalog are represented with red circles. The red arrows represent their displacement in 105 yr. The Tycho-2 or HIPPARCOS name and TGAS distance of each star are reported as labels for each object.
Current usage metrics show cumulative count of Article Views (full-text article views including HTML views, PDF and ePub downloads, according to the available data) and Abstracts Views on Vision4Press platform.
Data correspond to usage on the plateform after 2015. The current usage metrics is available 48-96 hours after online publication and is updated daily on week days.
Initial download of the metrics may take a while.