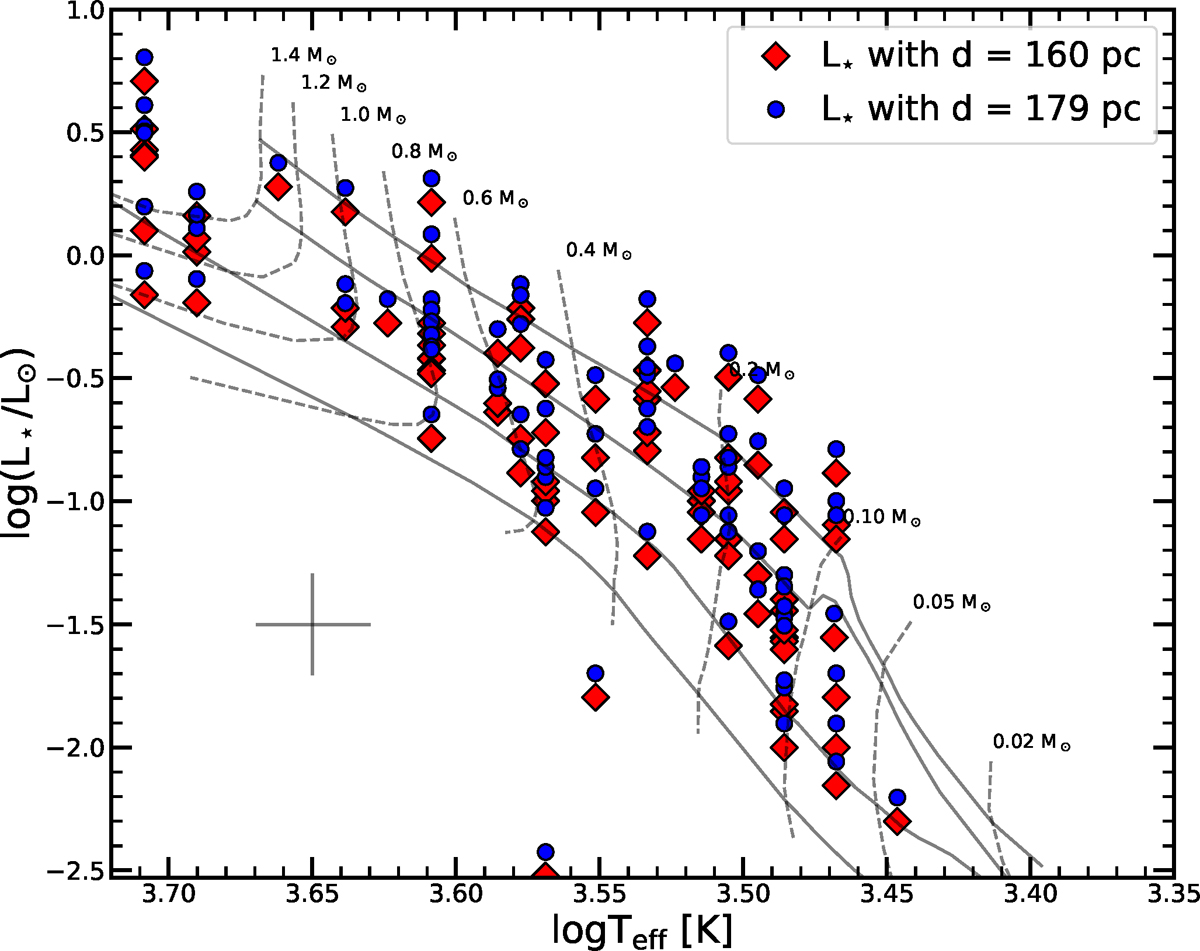
Fig. 14

Hertzsprung Russel diagram (HRD) of young stars with disks in the Chamaeleon I region studied by Manara et al. (2016, 2017). The red diamonds and blue circles indicate L⋆ computed with the distance of 160 pc found by Whittet et al. (1997) with our distance of 179 pc, respectively. Typical uncertainties are shown with a cross in the bottom left corner. The evolutionary models (isochrones in solid lines and evolutionarytracks with dashed lines) are taken from Baraffe et al. (2015).
Current usage metrics show cumulative count of Article Views (full-text article views including HTML views, PDF and ePub downloads, according to the available data) and Abstracts Views on Vision4Press platform.
Data correspond to usage on the plateform after 2015. The current usage metrics is available 48-96 hours after online publication and is updated daily on week days.
Initial download of the metrics may take a while.


