Free Access
Fig. 13
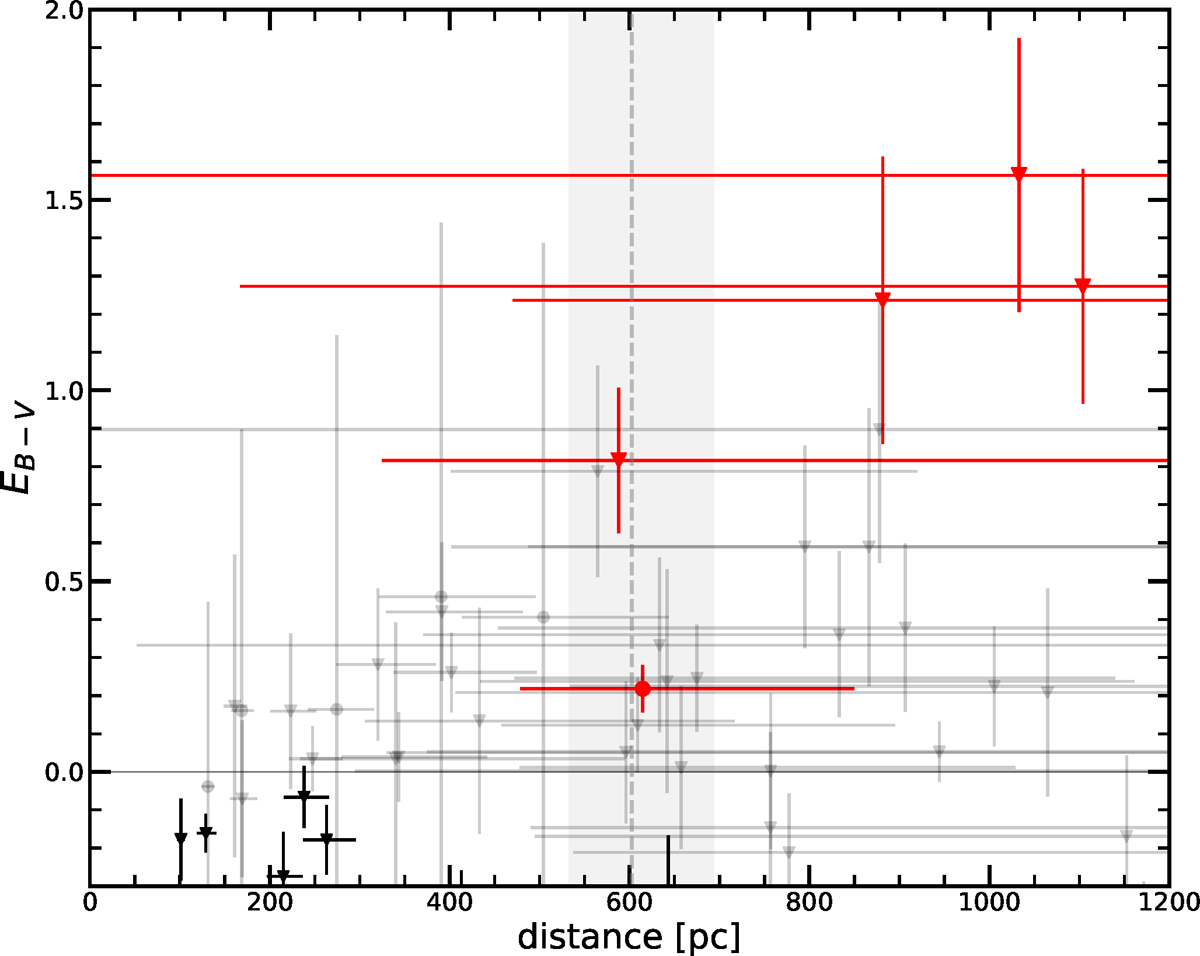
Extinction distribution along the line of sight of Musca. Symbols as in Fig. 6. The dashed line indicates the inverted mean value of the parallaxes of the first two reddened stars, with its statistical uncertainty shown with a gray region.
Current usage metrics show cumulative count of Article Views (full-text article views including HTML views, PDF and ePub downloads, according to the available data) and Abstracts Views on Vision4Press platform.
Data correspond to usage on the plateform after 2015. The current usage metrics is available 48-96 hours after online publication and is updated daily on week days.
Initial download of the metrics may take a while.