Fig. 8
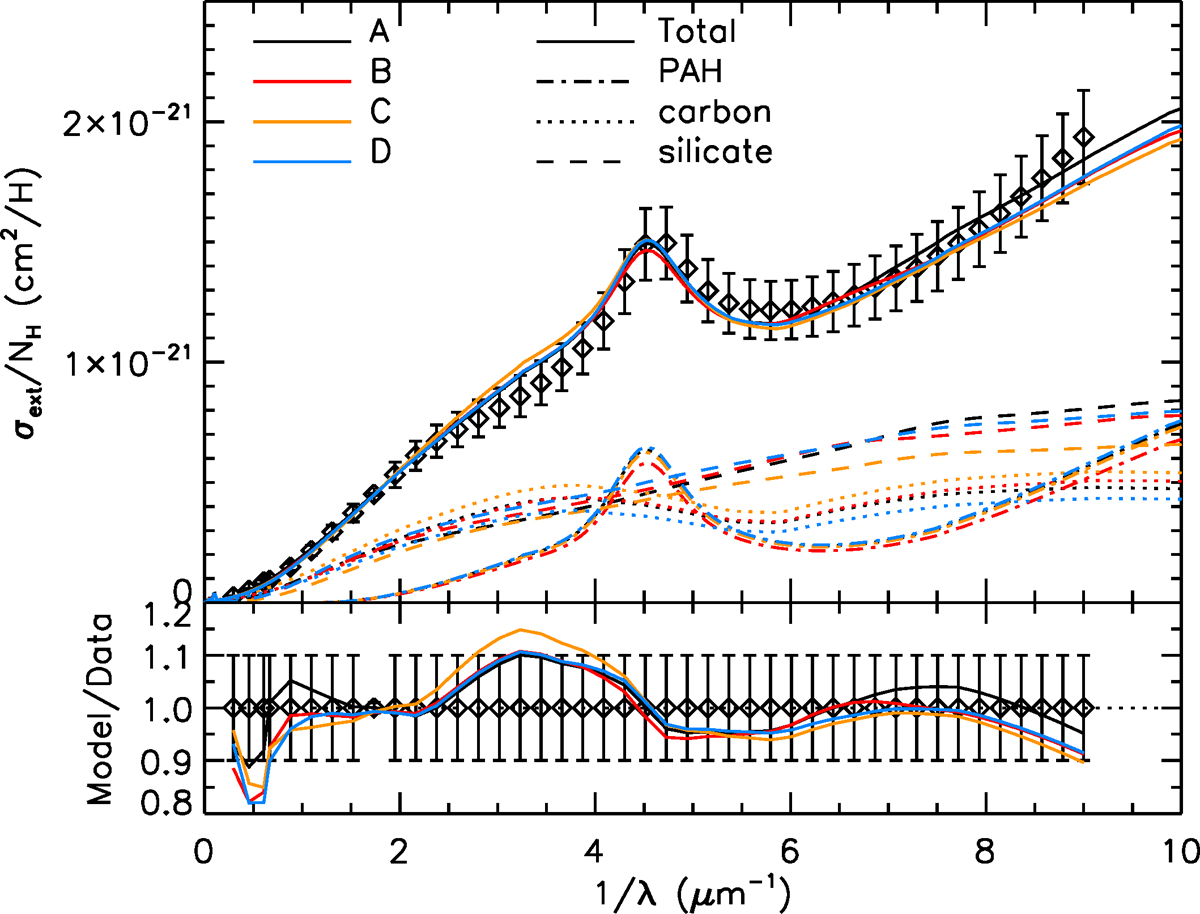
Extinction cross-section per H for our four models as a function of inverse wavelength, with the contribution of each component. Error bars are of 10%, except around the V band where it is 1%. The lower panel represents a normalized version of the upper panel, where each model has been divided by the data value at each frequency of measure to emphasize the difference between models.
Current usage metrics show cumulative count of Article Views (full-text article views including HTML views, PDF and ePub downloads, according to the available data) and Abstracts Views on Vision4Press platform.
Data correspond to usage on the plateform after 2015. The current usage metrics is available 48-96 hours after online publication and is updated daily on week days.
Initial download of the metrics may take a while.