Fig. 2
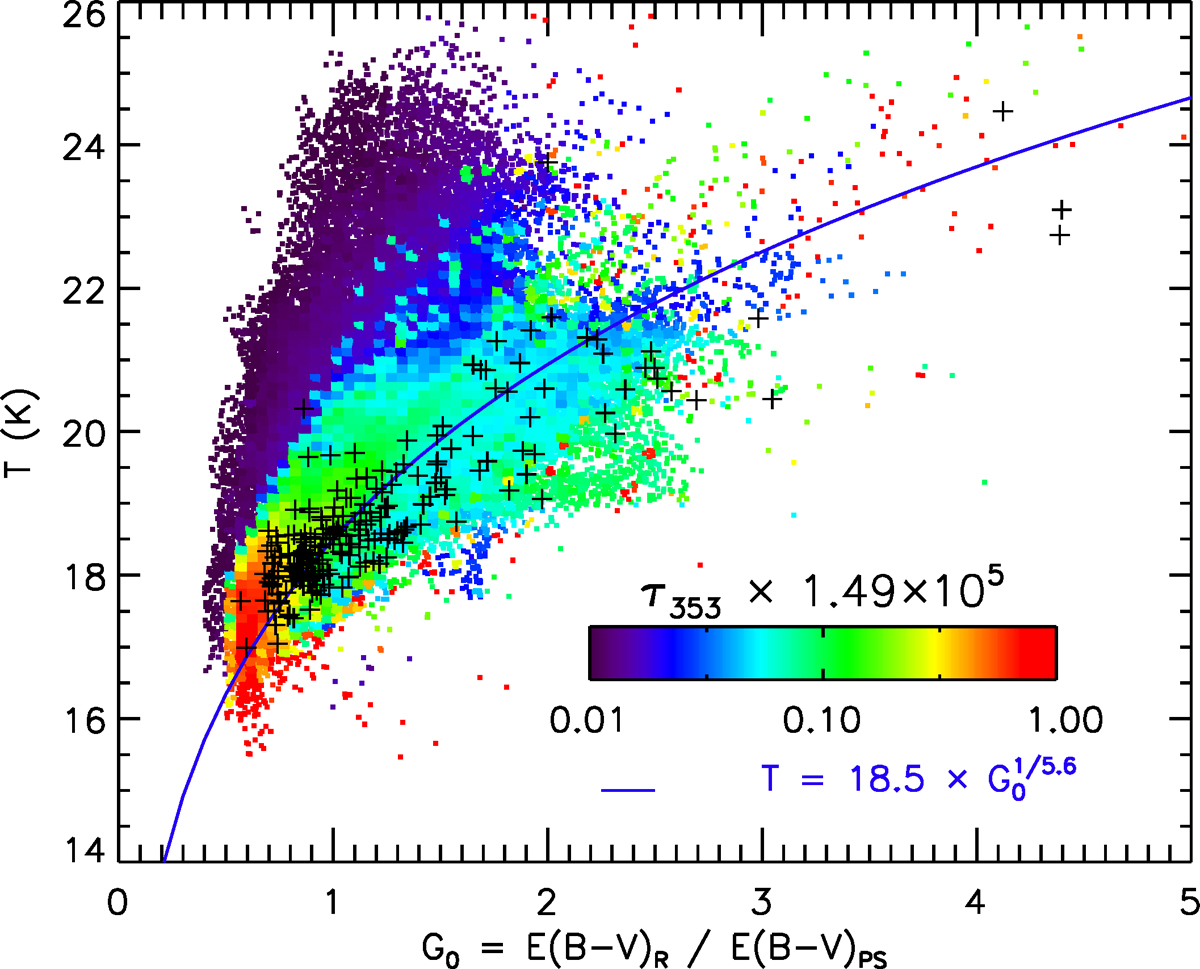
Planck dust temperature, T, as a functionof our estimate for the radiation field intensity, ![]() , colored by the Planck dust optical depth at 353 GHz, τ353, converted to a reddening (Planck Collaboration XI 2014; Planck Collaboration XLVIII 2016). The blue curve is the prediction for dust with fixed optical properties. Black crosses indicate the position in that plot for the 206 stars from Paper I.
, colored by the Planck dust optical depth at 353 GHz, τ353, converted to a reddening (Planck Collaboration XI 2014; Planck Collaboration XLVIII 2016). The blue curve is the prediction for dust with fixed optical properties. Black crosses indicate the position in that plot for the 206 stars from Paper I.
Current usage metrics show cumulative count of Article Views (full-text article views including HTML views, PDF and ePub downloads, according to the available data) and Abstracts Views on Vision4Press platform.
Data correspond to usage on the plateform after 2015. The current usage metrics is available 48-96 hours after online publication and is updated daily on week days.
Initial download of the metrics may take a while.