Fig. 10
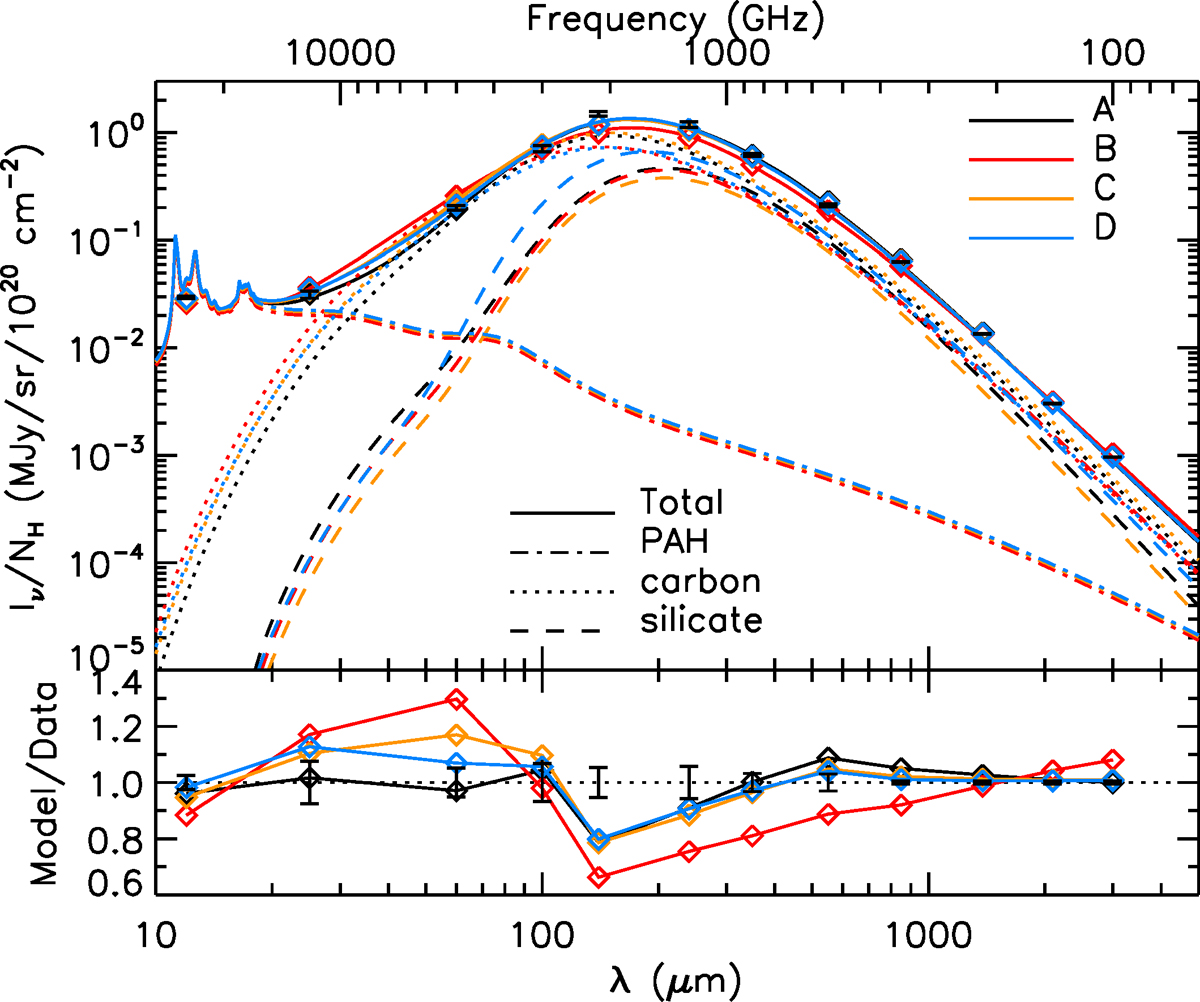
Dust emission SED as a function of wavelength, for our four models, with the contribution of each component. Data points and error bars are from Table 1, with a lower limit of 1% on error bars (see Sect. 4.3). Diamonds indicate for each model the color-corrected value of the modeled SED in each band of Table 1 (approximately + 12% at 353 GHz).
Current usage metrics show cumulative count of Article Views (full-text article views including HTML views, PDF and ePub downloads, according to the available data) and Abstracts Views on Vision4Press platform.
Data correspond to usage on the plateform after 2015. The current usage metrics is available 48-96 hours after online publication and is updated daily on week days.
Initial download of the metrics may take a while.