| Issue |
A&A
Volume 609, January 2018
|
|
|---|---|---|
| Article Number | A131 | |
| Number of page(s) | 4 | |
| Section | Extragalactic astronomy | |
| DOI | https://doi.org/10.1051/0004-6361/201731725 | |
| Published online | 05 February 2018 | |
Messier 81’s Planck view versus its halo mapping
1 Center for Cosmology and Astrophysics, Alikhanian National Laboratory and Yerevan State University, 0036 Yerevan, Armenia
e-mail: depaolis@le.infn.it
2 SIA, Sapienza University of Rome, 00185 Rome, Italy
3 Dipartimento di Matematica e Fisica “E. De Giorgi”, Università del Salento, via per Arnesano, 73100 Lecce, Italy
4 INFN, Sezione di Lecce, via per Arnesano, 73100 Lecce, Italy
5 Department of Physics, School of Natural Sciences, National University of Sciences and Technology, 44000 Islamabad, Pakistan
6 Physik-Institut, Universität Zürich, Winterthurerstrasse 190, 8057 Zürich, Switzerland
7 Department of Physics, University of Trento, 38123 Povo, Trento, Italy and TIFPA/INFN, 38123 Povo, Italy
Received: 6 August 2017
Accepted: 3 October 2017
This paper is a follow-up of a previous paper about the M 82 galaxy and its halo based on Planck observations. As in the case of M 82, a substantial north-south and east-west temperature asymmetry is also found for the M 81 galaxy, extending up to galactocentric distances of about 1.5°. The temperature asymmetry is almost frequency independent and can be interpreted as a Doppler-induced effect related to the M 81 halo rotation and/or triggered by the gravitational interaction of the galaxies within the M 81 Group. Along with the analogous study of several nearby edge-on spiral galaxies, the cosmic microwave background temperature asymmetry method thus is shown to act as a direct tool to map the galactic haloes and/or the intergalactic bridges, invisible in other bands or by other methods.
Key words: galaxies: general / galaxies: individual: M 81 / galaxies: halos
© ESO, 2018
1. Introduction
Cosmic microwave background (CMB) data are mainly used with the primary aim of inferring the values of the parameters of the cosmological standard model. In addition, CMB data also offer a unique opportunity to study the large-scale temperature asymmetries far beyond the size typically accessible with other tools toward nearby astronomical systems (see, e.g., Rauzy & Gurzadyan 1998; De Paolis et al. 2011). Here we continue the use of CMB data to map the dark haloes of nearby galaxies, the latter often studied in most details on other bands or via other methods. Indeed, in the recent past we have analyzed Planck data toward four nearby galaxies with the main aim of testing if microwave data show a substantial temperature asymmetry of one side with respect to the other about the rotation axis of the Galactic disks. We have considered, in particular: M31 galaxy and its halo (De Paolis et al. 2014), the active radio galaxy Centaurus A (Cen A) that is considered the closest active galactic nucleus (AGN; De Paolis et al. 2015), M 82, the largest galaxy in the M 81 Group in the Ursa Major constellation (Gurzadyan et al. 2015), and the M33 galaxy where we found a substantial temperature asymmetry with respect to its minor axis projected onto the sky plane, which extends up to about 3° from the Galactic center and correlates well with the HI velocity field at 21 cm, at least within about 0.5° (De Paolis et al. 2016). We emphasize that the very fact that the detected temperature asymmetries are always almost frequency independent is a strong indication of an effect due to the galaxy rotation and we remark the importance of the methodology proposed which, in spite of its simplicity, may allow one to consistently estimate the galaxy dynamical mass contained within a certain galactocentric distance. We have also shown that, in general, our method can be applied to nearby nearly edge-on spirals and may be used to trace the halo bulk dynamics on rather large scales in a model-independent way. The present paper is a follow-up of the previous paper on the M 82 galaxy (Gurzadyan et al. 2015) where a substantial north-south and east-west temperature asymmetry was found, extending up to about 1° from the center of M 82. The main conclusion about the origin of the temperature asymmetry (almost frequency independent) was its link with a Doppler-induced effect regarding the line-of-sight dynamics on the real halo scale (which is invisible in other bands), the ejections from the Galactic center, or the tidal interaction of M 82 with the M 81 galaxy. Here, we consider again this issue from the point of view of the M 81 galaxy, one of the last objects in the Local Group that can be studied by available Planck data.
2. Planck data analysis and results toward M 81
M 81, also known as Bode’s galaxy (or NGC 3031), at J2000 coordinates RA: 09h55m33.1730s, Dec: +69°3′55.061″ (Galactic longitude l = 142.0918406°, Galactic latitude b = 40.9001409°) is a SA(s)ab type galaxy at a distance of 3.6 ± 0.2 Mpc from us (see, e.g., Gerke et al. 2011). Following the procedures described in the previous papers, we have used the publicly released Planck 2015 data1Planck Collaboration I (2016) in the 70 GHz bands of the Low Frequency Instrument (LFI), and in the bands at 100 GHz, 143 GHz, and 217 GHz of the High Frequency Instrument (HFI). We have also used the foreground-corrected SMICA map (indicated as SmicaH in Figs. 2 and 3), which should display the lowest contamination by the Galactic foregrounds. We notice here that Planck’s resolution is 13.2′, 9.6′, 7.1′, and 5′ in terms of full width at half maximum (FHWM) at 70, 100, 143, and 217 GHz bands, respectively, and frequency maps (Planck Collaboration XVI 2016) are provided in CMB temperature at a resolution corresponding to Nside = 2048 in the HEALPix scheme (Górski et al. 2005).
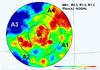 |
Fig. 1 Planck field toward the M 81 galaxy in the 143 GHz band. The pixel color gives the temperature excess in μK with respect to the mean CMB temperature. The optical extension of the M 81 galaxy is indicated by the inner ellipse with apparent dimensions of 26.9′ and 14.1′, respectively. The four quadrants A1, A2, A3, and A4 are used in the analysis. The thin dashed black line marks the Galactic latitude b = 40° north. We note that the M 82 galaxy is clearly visible as the red spot in the A1 region at about 38′ from the center of M 81. |
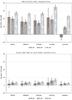 |
Fig. 2 Upper panel: temperature asymmetry toward M 81 in μK (with the standard errors) of the A1+A2 region (indicated as A12) with respect to the A3+A4 region (A34) in the five considered Planck bands (see text for details) within three radial distances of 30′ (R0.50), 60′ (R1.00), and 90′ (R1.50). Bottom panel: same for the 360 control fields with the same geometry (shown in Fig. 1) equally spaced at one degree distance from each other in Galactic longitude and at the same latitude as M 81. |
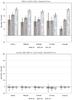 |
Fig. 3 Upper panel: temperature asymmetry toward M 81 in μK (with the standard errors) of the A1+A4 region (A14) with respect to the A2+A3 region (A23) in the five considered Planck bands. Bottom panel: same for the 360 control fields. |
Planck field of the region of interest (we give in Fig. 1 the map in the case of the 143 GHz band) has been divided into four quadrants A1, A2, A3, and A4. As detailed in the histograms in Figs. 2 and 3, we have considered the temperature asymmetry in three radial regions about the M 81 center within 0.5°, 1°, and 1.5° (indicated as R0.50, R1.00, and R1.50, respectively). In Fig. 1 the optical extension of the M 81 galaxy is shown, as indicated by the inner ellipse. In Fig. 2 we give the temperature asymmetry toward M 81 in μK (with the standard errors) of the A1+A2 region (A12) with respect to the A3+A4 region (A34) in the five considered Planck bands within the three radial distances. In the bottom panel we give the same for the 360 control fields with the same geometry (shown in Fig. 1) equally spaced at one degree distance from each other in Galactic longitude and at the same latitude as M 81. As one can see from Fig. 2 and as expected by considering the rotation direction of the M 81 disk about its rotation axis, the A12 region always appears hotter than the A34 region by 32–44μK within 0.5°, by 28–40 μK within 1°, and by about 50–70 μK within 1.5°.We note that the control fields show a much smaller temperature asymmetry of only a few μK and that the detected effect is practically the same in each of the five Planck bands. We also note that the size of the virial radius of the M 81 galaxy (equivalent to the R200 radius where the galaxy density is about 200 times larger than the critical density) can be estimated to be about 3.6° (Chiboucas et al. 2009).Although from the geometry and the direction rotation of the M 81 disk the expected temperature asymmetry was along the A12/A34 axis, we have also considered the temperature asymmetry toward M 81 in the A14 region with respect to the A23 region and found an even more consistent asymmetry in all the considered Planck bands. This resembles what was already found toward the companion galaxy M 82 (Gurzadyan et al. 2015). In the present case the temperature asymmetry amounts to 40–80 μK as implied by a prolate M 81 halo rotation, while the control fields always show an asymmetry consistent to zero (see Fig. 3). As far as the foreground-corrected SMICA band is concerned, the temperature asymmetry is negligible within 0.5° (although one has to consider that the pixel number in this region is very low) and increases to large values within 1° and 1.5°. Also SMICA data show a clear and more consistent A14/A23 temperature asymmetry with values comparable with those in the other bands within R1.00 and R1.50, although within 0.5° there may be a non-negligible foreground contamination in the other Planck bands.
3. Discussion
Similar to the case of the other galaxies of the Local Group considered previously and in particular toward M 82, we found a consistent north-south and east-west temperature asymmetry also toward the M 81 galaxy, that reaches values up to about 80 μK within 1.5° in all considered Planck bands. We believe that the most plausible explanation relies on a Doppler-induced effect due to the spin of the M 81 halo, possibly along an axis tilted (up to about 90°) with respect to the rotation axis of the M 81 disk. In this case the temperature asymmetry can be estimated from the equation ΔT/T = 2vsiniS ⟨ τ ⟩ /c, according to the model first discussed in De Paolis et al. (1995b), where v is the M 81 rotation velocity, i ≃ 58° is the M 81 disk inclination angle, S is the gas or dust filling factor, and ⟨ τ ⟩ is the averaged optical depth within a given Planck band. In order to account for the detected temperature anisotropy, however, the M 81 halo should be filled by a relatively large amount of gas (likely in the form of cold gas clouds), as in the models proposed, for example, by Pfenniger et al. (1994), De Paolis et al. (1995a), Gerhard & Silk (1996). A viable explanation of the detected effect could be, in principle, also the rotational kinematic Sunyaev-Zel’dovich (rkSZ) effect, which is known to be active on galaxy cluster scales (Cooray et al. 2002; Chluba et al. 2002; Manolopoulou et al. 2017). Naturally, to be active, the rkSZ effect does require the presence of a conspicuous population of high energy electrons in the rotating M 81 halo. By rescaling to the free electron density, temperature, and size of the galaxy halos the effect appears to be smaller by at least one order of magnitude (with respect to that in galaxy clusters), giving expected temperature asymmetries below a few μK. However, it might be that the temperature asymmetry derives from a multi component effect due to the presence of cold gas clouds together with a halo of a hot and also, possibly, a warm component. Also other effects, such as the case that M 81 is an interacting system with a rather recent merging event, may induce an increase in the temperature asymmetry, as outlined in the following discussion.
Many galaxies belong to multiple systems and constitute dynamically linked objects that are affected by their mutual gravitational interaction. An example of such systems is indeed constituted by the M 81, M 82, and NGC 3077 galaxies (the first two objects interacted about 200 Myrs ago, see e.g. Makarova et al. 2002; Sun et al. 2005; Heithausen 2012; Oehm et al. 2017). The radio images of the system, obtained for example by the very large array (VLA) radio telescopes (see Yun et al. 1994), show with strong evidence that the HI gas is not only associated with each galaxy but is also present around the galaxies and in the intergalactic space. Clear gaseous filaments are visible among the three major objects of the galaxy group (which is likely composed of at least six objects: M 81, M 82, NGC 3077, Holmberg IX, Arp’s Loop, and NGC 2976 (see, e.g., Bremnes et al. 1998; Karachentsev et al. 2002; Makarova et al. 2002). This gas and the associated dust could give some contribution to the detected temperature asymmetry toward the M 81 halo. In this respect we note that an enhancement of the emission arising from the rkSZ effect is expected to occur in recent merging events of rich galaxy clusters giving temperature asymmetries up to 146 μK (Chluba et al. 2002). In the present case, the previous merging event between the M 81 and M 82 galaxies might have generated large-scale turbulence and bulk motion with an increase of the free electron density and temperature, which may amplify the rkSZ effect producing possibly temperature asymmetries up to 10–20μK (although a realistic estimate of the effect would require a detailed hydrodynamic modeling of the past merging event). We also mention that the presence of baryonic jets from an ultraluminous supersoft X-ray source discovered in the M 81 galaxy, called ULS-1 (see Liu et al. 2015, and references therein), may lead to an unexpected growth of the high-energy electrons and hot plasma populations in the M 81 halo.
Moreover, there could also be some contribution to the detected temperature asymmetry from high-latitude gas clouds in our Galaxy along the line of sight toward M 81. In this respect we note that M 81 is at about 40.9° north of the Galactic disk, where contamination from the Milky Way is expected to be low. However, interpretation of astronomical observations is often hampered by the lack of direct distance information. Indeed, it is often not easy to judge whether objects on the same line of sight are physically related or not. Since the discovery of the Arp’s Loop (Arp 1965) the nature of the interstellar clouds in this region has been debated; in particular whether they are related to the tidal arms around the galaxy triplet (Sun et al. 2005; de Mello et al. 2008) or to Galactic foreground cirrus (Sollima et al. 2010; Davies et al. 2010). Already Sandage et al. (1976) presented evidence showing that we are observing the M 81 triplet through widespread Galactic foreground cirrus clouds and de Vries et al. 1987 built large-scale HI, CO, and dust maps that showed Galactic cirrus emission toward the M 81 region with NH ≃ 1−2 × 1020 cm-2. The technique used to distinguish between the emission from extragalactic or Galactic gas and dust relies on spectral measurements and on the identification of the line of sight velocities, which are expected to be different in each case. Unfortunately, in the case of the M 81 Group, this technique appears hardly applicable since the radial velocities of extragalactic and Galactic clouds share a similar LSR (local standard of rest) velocity range (Heithausen 2012). Several small-area molecular clouds (SAMS), that is, tiny molecular clouds in a region where the shielding of the interstellar radiation field is too low (so that these clouds cannot survive for a long time), have been detected by Heithausen (2002) toward the M 81 Group. More recently, data from the Spectral and Photometric Imaging Receiver (SPIRE) instrument onboard Herschel ESA space observatory and Multiband Imaging Photometer for Spitzer (MIPS) onboard Spitzer allowed the identification of several dust clouds north of the M 81 galaxy with a total hydrogen column density in the range 1.5–5 × 1020 cm-2 and dust temperatures between 13 and 17 K (Heithausen 2012). However, since there is no obvious difference among the individual clouds, there was no way to distinguish between Galactic or extragalactic origin although it is likely that some of the IR emission both toward M 81 and NGC 3077 is of Galactic origin. Temperature asymmetry studies in Planck data may be indicative of the bulk dynamics in the observed region provided that other Local (Galactic) contamination in the data is identified and subtracted. This is not always possible, as in the case of the M 81 Group, and therefore it would be important to identify and study other examples of dust clouds where their origin, either Galactic or extragalactic, is not clear. One such example might be provided by the interacting system toward NGC 4435/4438 (Cortese et al. 2010) where the SAMS found appear more consistent with Galactic cirrus clouds than with extragalactic molecular complexes. Incidentally, the region A1 within R0.50 has been studied by Barker et al. (2009), who found evidence for the presence of an extended structural component beyond the M 81 optical disk, with a much flatter surface brightness profile, which might contain ≃10–15% of the M 81 total V-band luminosity. However, the lack of both a similar analysis in the other quadrants (and at larger distances from the M 81 center) and the study of the gas and dust component associated to this evolved stellar population, hamper our understanding of whether this component may explain the observed temperature asymmetry toward the M 81 halo.
Although the physical origin of the detected temperature asymmetry is not clearly identified at present, it appears obvious that the CMB asymmetry method is tracing the M 81 halo and intergalactic bridges, not directly revealed in other bands and via conventional methods, based on stellar population studies, interstellar medium, and other factors. In order to assess this issue, high-resolution and extended (up to ≃1.5°) observations to infer the distribution of the cold, warm, and hot gas components appears to be an urgent task to be performed. In this respect we emphasize that, in addition to radio observations at 21 cm to map the HI component of the gas (integrated also by other techniques to study small-scale cold structures as done, e.g., through interstellar scintillations by Habibi et al. 2011) and to the X-ray band diffuse emission to infer the amount and distribution of the hot gas component, investigation of the warm gas component with the methodology employed, for example, in Nicastro et al. (2016) is extremely important. Given the serious quantitative disagreement between the microwave temperature asymmetry amplitude revealed for M 81 and several other nearby galaxies and the rkSZ contributions there, the latter’s alternative may be more exotic halo models (see, e.g., Lovell et al. 2016; Okumura et al. 2017; Piras et al. 2018; Pace VanDevender et al. 2017; Gurzadyan and Kocharyan 2009), a dilemma to be solved by future studies.
In conclusion, the available Planck data has enabled us to trace, by this method, the haloes in the nearby edge-on spirals previously analyzed, while higher resolution data can be efficient for the study of galaxies also outside the Local Group. This is particularly important in view of the next generation CMB experiments, such as LiteBird (Hazumi et al. 2012), CMB-S4 (Abazajian et al. 2016), CORE (Cosmic Origins Explorer; Finelli et al. 2016), DeepSpace2, PIXIE (Primordial Inflation Explorer; Kogut et al. 2011), and Polarbear (Ade et al. 2014), which will attempt even more precise measurements of the CMB than have been available so far. Many of these experiments are designed to cover mainly the frequency range around 100 GHz where the relative intensity of the CMB is known to be highest and where one of the most dominant foreground components is dust emission (see, e.g., Liu et al. 2017). Understanding the properties of dust emission and distinguishing between Galactic foregrounds and extragalactic emission is an important premise for the optimized use of the next generation CMB experiments.
From the Planck Legacy Archive, http://pla.esac.esa.int
See the DeepSpace website at http://deep-space.nbi.ku.dk
Acknowledgments
We acknowledge the helpful comments by the referee and the use of Planck data in the Legacy Archive for Microwave Background Data Analysis (LAMBDA) and HEALPix (Górski et al. 2005) package. F.D.P., A.A.N., and G.I. acknowledge the support by the INFN projects TAsP and EUCLID. P.J. acknowledges support from the Swiss National Science Foundation. AQ is grateful for the hospitality of the DST Centre of Excellence in Mathematical & Statistical Sciences of the University of the Witwatersrand, Johannesburg.
References
- Abazajian, K. N., Adshead, P., Ahmed, Z., et al. 2016, ArXiv e-prints [arXiv:1610.02743] [Google Scholar]
- Ade, P. A. R., Akiba, Y., Anthony, A. E., et al. (The Polarbear Collaboration) 2014, ApJ, 794, 171 [NASA ADS] [CrossRef] [Google Scholar]
- Arp, H. 1965, Science, 148, 363 [NASA ADS] [CrossRef] [PubMed] [Google Scholar]
- Barker, M. K., Ferguson, A. M. N., Irwin, M., et al. 2009, AJ, 138, 1469 [NASA ADS] [CrossRef] [Google Scholar]
- Bremnes, T., Binggeli, B., & Prugniel, P. 1998, A&AS, 129, 313 [NASA ADS] [CrossRef] [EDP Sciences] [Google Scholar]
- Chiboucas, K., Karachentsev, I. D., & Tully, R. B. 2009, AJ, 137, 3009 [NASA ADS] [CrossRef] [Google Scholar]
- Chluba, J., & Mannheim, K. 2002, A&A, 396, 419 [NASA ADS] [CrossRef] [EDP Sciences] [Google Scholar]
- Cooray, A., & Chen, X. 2002, ApJ, 573, 43 [NASA ADS] [CrossRef] [Google Scholar]
- Cortese, L., Bendo, G. J., Isaak, K. G., et al. 2010, MNRAS, 403, L26 [NASA ADS] [CrossRef] [Google Scholar]
- Davies, J. L., Wilson, C. D., Aud, R., et al. 2010, MNRAS, 409,102 [NASA ADS] [CrossRef] [Google Scholar]
- de Mello, D. F., Smith, L. J., Sabbi, E., et al. 2008, AJ, 135, 548 [NASA ADS] [CrossRef] [Google Scholar]
- De Paolis, F., Ingrosso, G., Jetzer, Ph., et al. 1995a, A&A, 295, 567 [NASA ADS] [Google Scholar]
- De Paolis, F., Ingrosso, G., Jetzer, Ph., et al. 1995b, A&A, 299, 647 [NASA ADS] [Google Scholar]
- De Paolis, F., Gurzadyan, V. G., Ingrosso, G., et al. 2011, A&A, 534, L8 [NASA ADS] [CrossRef] [EDP Sciences] [Google Scholar]
- De Paolis, F., Gurzadyan, V. G., Nucita, A. A., et al. 2014, A&A, 565, L3 [NASA ADS] [CrossRef] [EDP Sciences] [Google Scholar]
- De Paolis, F., Gurzadyan, V. G., Nucita, A. A., et al. 2015, A&A, 580, L8 [NASA ADS] [CrossRef] [EDP Sciences] [Google Scholar]
- De Paolis, F., Gurzadyan, V. G., Nucita, A. A., et al. 2016, A&A, 593, A57 [NASA ADS] [CrossRef] [EDP Sciences] [Google Scholar]
- de Vries, H. W., Heithausen, A., & Thaddeus, P. 1987, ApJ, 319, 723 [NASA ADS] [CrossRef] [Google Scholar]
- Finelli, F., Bucher, M., Achúcarro, A., et al. (CORE Collaboration) 2016, ArXiv e-prints [arXiv:1612.08270] [Google Scholar]
- Gerhard, O. E., & Silk, J. 1996, ApJ, 472, 34 [Google Scholar]
- Gerke, J. R., Kochanek, C. S., Prieto, J. L., et al. 2011, ApJ, 743, 176 [NASA ADS] [CrossRef] [Google Scholar]
- Górski, K. M., Hivon, E., Banday, A. J., et al. 2005, ApJ, 622, 759 [NASA ADS] [CrossRef] [Google Scholar]
- Gurzadyan, V. G., & Kocharyan, A. A., 2009, A&A, 493, L61 [NASA ADS] [CrossRef] [EDP Sciences] [Google Scholar]
- Gurzadyan, V. G., De Paolis, F., Nucita, A., et al. 2015, A&A, 582, A77 [NASA ADS] [CrossRef] [EDP Sciences] [Google Scholar]
- Habibi, F., Moniez, M., Ansari, R., & Rahvar, S. 2011, A&A, 525, A108 [NASA ADS] [CrossRef] [EDP Sciences] [Google Scholar]
- Hazumi, M., Borrill, J., Chinone, Y., et al. 2012, Proc. SPIE, 8442, 844219 [CrossRef] [Google Scholar]
- Heithausen, A. 2002, A&A, 393, L41 [NASA ADS] [CrossRef] [EDP Sciences] [Google Scholar]
- Heithausen, A. 2012, A&A, 543, A21 [NASA ADS] [CrossRef] [EDP Sciences] [Google Scholar]
- Liu, J.-F., Bai, Y., Wang, S., et al. 2015, Nature, 528, 108 [NASA ADS] [CrossRef] [Google Scholar]
- Liu, H., von Hausegger, S., & Naselsky, P. 2017, Phys. Rev. D, 95, 103517 [NASA ADS] [CrossRef] [Google Scholar]
- Lovell, M. R., Bose, S., Boyarsky, A., et al. 2017, MNRAS, 468, 4285 [NASA ADS] [CrossRef] [Google Scholar]
- Karachentsev, I. D., Dolphin, A. E., & Geisler, D. 2002, A&A, 383, 125 [NASA ADS] [CrossRef] [EDP Sciences] [Google Scholar]
- Kogut, A., Fixsen, D. J., Chuss, D. T., et al. 2011, J. Cosmol. Astropart. Phys., 7, 025 [Google Scholar]
- Makarova, L. N., Grebel, E. K., & Karachentsev, I. D. 2002, A&A, 396, 473 [NASA ADS] [CrossRef] [EDP Sciences] [Google Scholar]
- Manolopoulou, M., & Plionis, M. 2017, MNRAS, 465, 2616 [NASA ADS] [CrossRef] [Google Scholar]
- Nicastro, F., Senatore, F., Gupta, A., et al. 2016, MNRAS, 457, 676 [NASA ADS] [CrossRef] [Google Scholar]
- Oehm, W., Thies, I., & Kroupa, P. 2017, MNRAS, 467, 273 [NASA ADS] [Google Scholar]
- Okumura, T., Nishimichi, T., Umetsu, K., & Osato, K. 2017, ArXiv e-prints [arXiv:1706.08860] [Google Scholar]
- Pace VanDevender, J., VanDevender, A. P., Sloan, T., et al. 2017, Nature Sci. Rep., 7, 8758 [NASA ADS] [CrossRef] [PubMed] [Google Scholar]
- Pfenniger, D., Combes, F., & Martinet, L. 1994, A&A, 285, 79 [NASA ADS] [Google Scholar]
- Piras, D., Joachimi, B., Schäfer, M., et al. 2018, MNRAS, 474, 1165 [NASA ADS] [CrossRef] [Google Scholar]
- Planck Collaboration I. 2016, A&A, 594, A1 [NASA ADS] [CrossRef] [EDP Sciences] [Google Scholar]
- Planck Collaboration XVI. 2016, A&A, 594, A16 [NASA ADS] [CrossRef] [EDP Sciences] [Google Scholar]
- Rauzy, S., & Gurzadyan, V. G. 1998, MNRAS, 298, 114 [NASA ADS] [CrossRef] [Google Scholar]
- Sandage, A. 1976, AJ, 81, 954 [NASA ADS] [CrossRef] [Google Scholar]
- Sollima, A., Gil de Paz, A., Martinez-Delgado, D., et al. 2010, A&A, 516, A83 [NASA ADS] [CrossRef] [EDP Sciences] [Google Scholar]
- Sun, W.-H., Zhou, X., Chen, W.-P., et al. 2005, ApJ, 630, L133 [NASA ADS] [CrossRef] [Google Scholar]
- Yun, M. S., Ho, P. T. P., & Lo, K. Y. 1994, Nature, 372, 530 [NASA ADS] [CrossRef] [PubMed] [Google Scholar]
All Figures
|
Fig. 1 Planck field toward the M 81 galaxy in the 143 GHz band. The pixel color gives the temperature excess in μK with respect to the mean CMB temperature. The optical extension of the M 81 galaxy is indicated by the inner ellipse with apparent dimensions of 26.9′ and 14.1′, respectively. The four quadrants A1, A2, A3, and A4 are used in the analysis. The thin dashed black line marks the Galactic latitude b = 40° north. We note that the M 82 galaxy is clearly visible as the red spot in the A1 region at about 38′ from the center of M 81. |
| In the text | |
|
Fig. 2 Upper panel: temperature asymmetry toward M 81 in μK (with the standard errors) of the A1+A2 region (indicated as A12) with respect to the A3+A4 region (A34) in the five considered Planck bands (see text for details) within three radial distances of 30′ (R0.50), 60′ (R1.00), and 90′ (R1.50). Bottom panel: same for the 360 control fields with the same geometry (shown in Fig. 1) equally spaced at one degree distance from each other in Galactic longitude and at the same latitude as M 81. |
| In the text | |
|
Fig. 3 Upper panel: temperature asymmetry toward M 81 in μK (with the standard errors) of the A1+A4 region (A14) with respect to the A2+A3 region (A23) in the five considered Planck bands. Bottom panel: same for the 360 control fields. |
| In the text | |
Current usage metrics show cumulative count of Article Views (full-text article views including HTML views, PDF and ePub downloads, according to the available data) and Abstracts Views on Vision4Press platform.
Data correspond to usage on the plateform after 2015. The current usage metrics is available 48-96 hours after online publication and is updated daily on week days.
Initial download of the metrics may take a while.