Free Access
Fig. 5
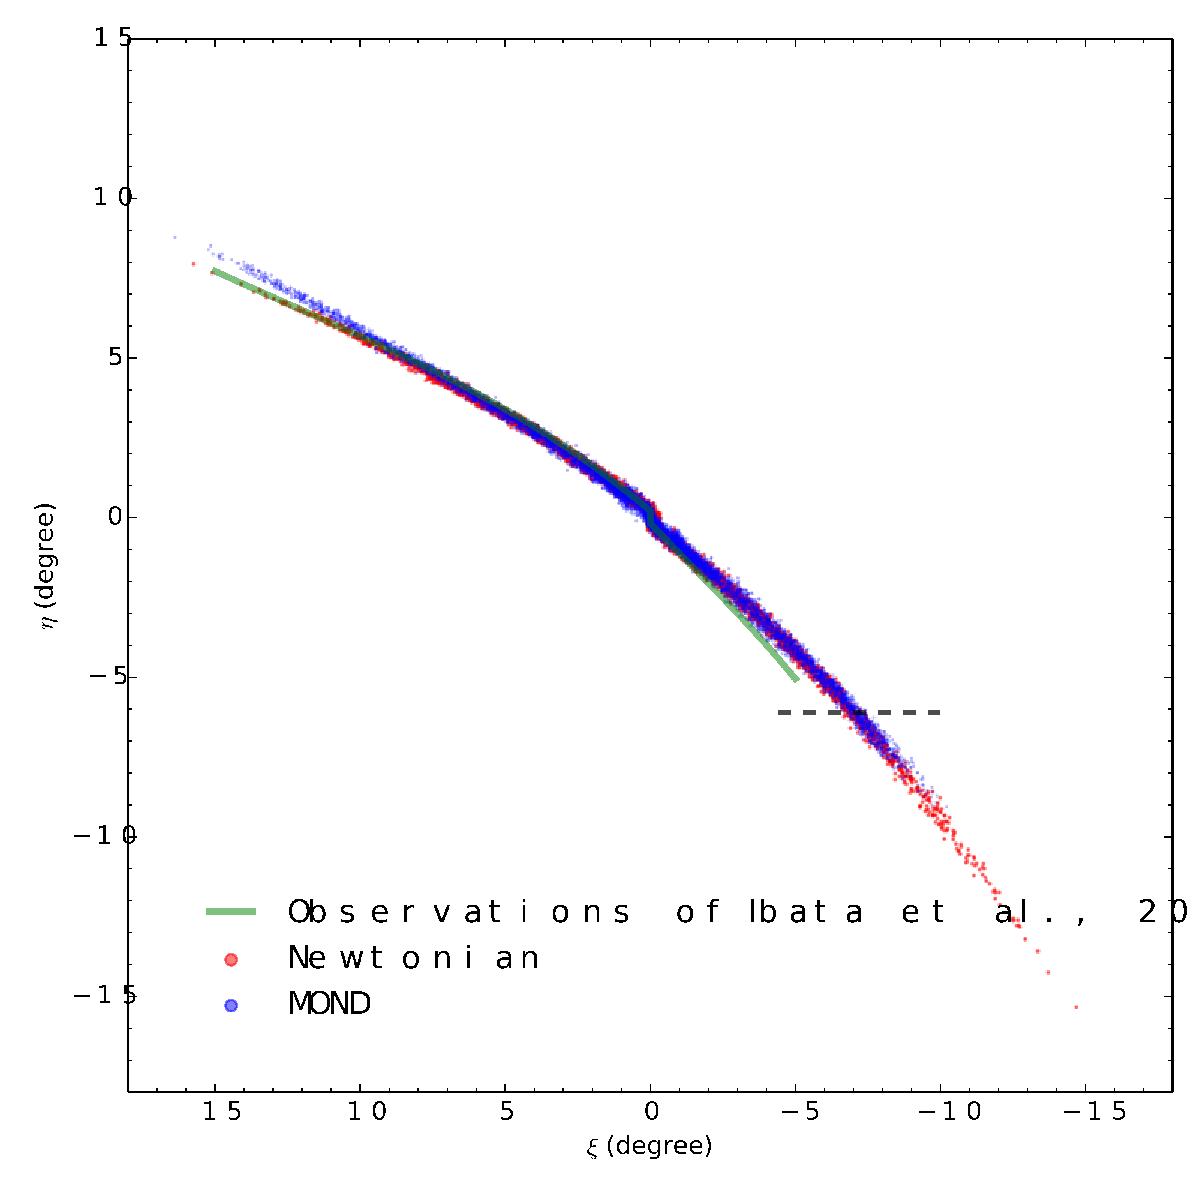
N-body particles of the fiducial MOND simulation (in blue) and of the Newtonian simulation (in red). The green line represents the fit of the center of the stream (Ibata et al. 2017) and the dark dashed line shows the limit of detection on the stream in the Pan-STARRS data (Bernard et al. 2016).
Current usage metrics show cumulative count of Article Views (full-text article views including HTML views, PDF and ePub downloads, according to the available data) and Abstracts Views on Vision4Press platform.
Data correspond to usage on the plateform after 2015. The current usage metrics is available 48-96 hours after online publication and is updated daily on week days.
Initial download of the metrics may take a while.