Fig. 2
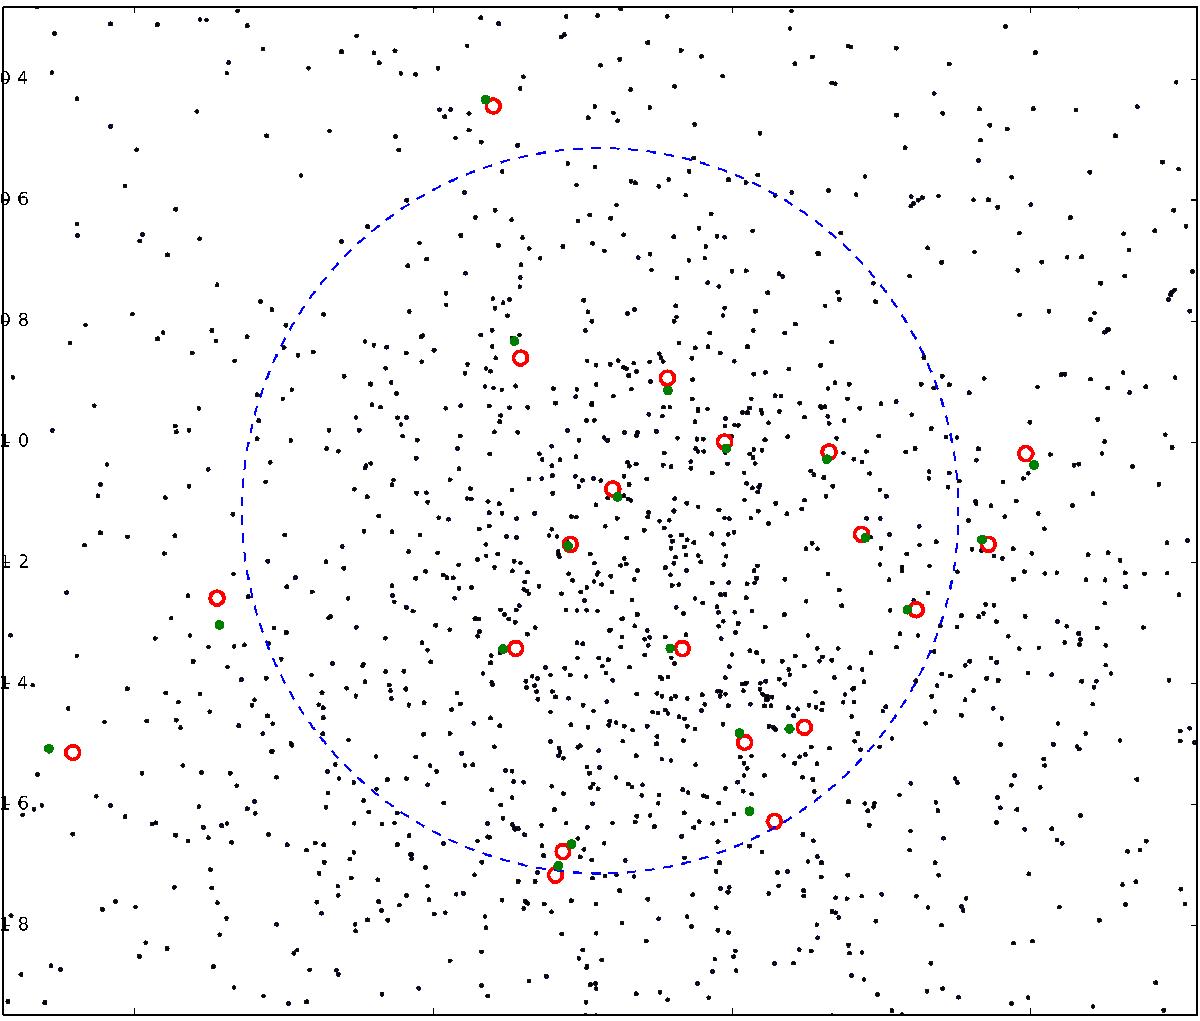
Projection of the central region of GC from our fiducial simulation after 2 Gyr of disruption. The red circles show the position of the stars used by Odenkirchen et al. (2002) to measure the central velocity dispersion and the green dots are the position of the closest particles from our simulation. The blue dashed circle represents the core radius of the Pal 5 GC as measured by Odenkirchen et al. (2002). The field of view has a size of 12′ × 10′ (82 pc × 68 pc) around the central position of the GC.
Current usage metrics show cumulative count of Article Views (full-text article views including HTML views, PDF and ePub downloads, according to the available data) and Abstracts Views on Vision4Press platform.
Data correspond to usage on the plateform after 2015. The current usage metrics is available 48-96 hours after online publication and is updated daily on week days.
Initial download of the metrics may take a while.