Fig. 2
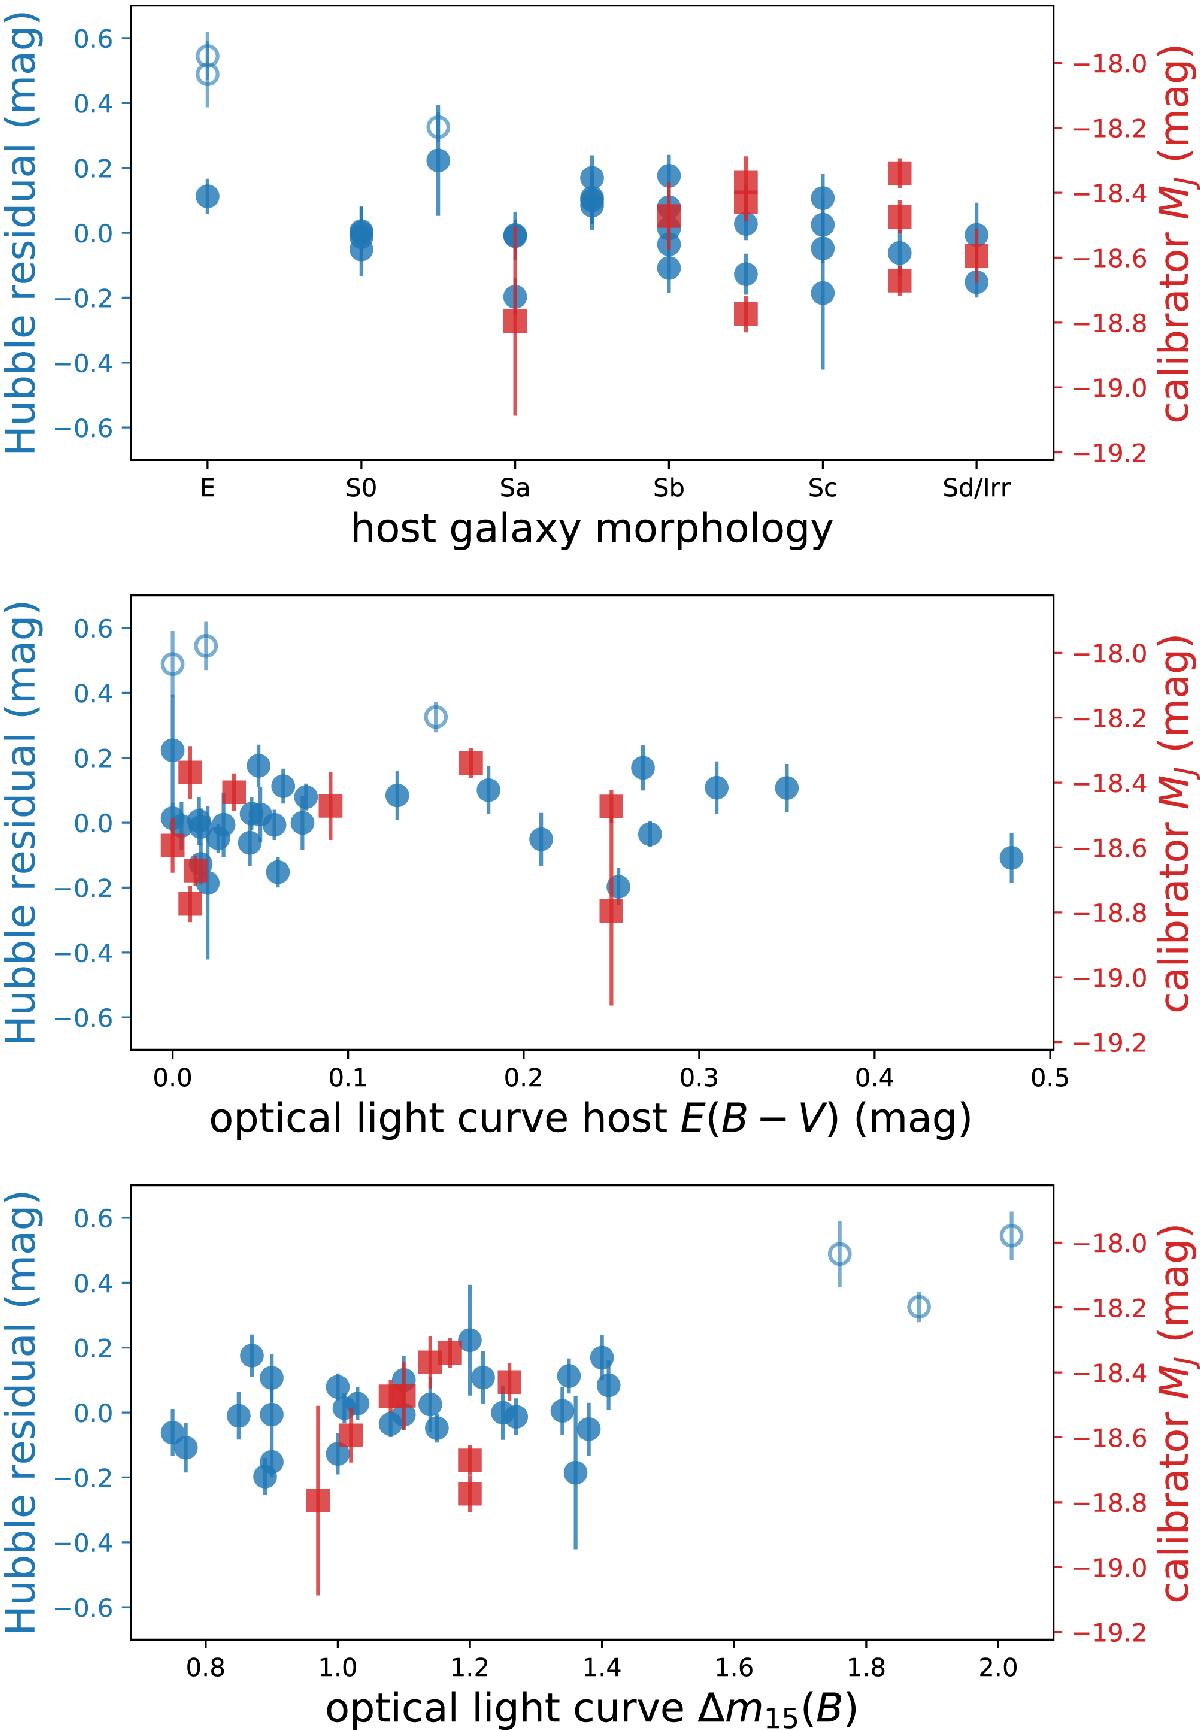
A comparison of the calibrator and Hubble-flow samples in host-galaxy morphology, host-galaxy reddening, and optical light-curve decline rate. Blue circles show the Hubble-flow sample J-band Hubble-diagram residuals (left axis), while red squares show the calibrator absolute J magnitudes (right axis). The open circles indicate three fast-declining SN Ia that are excluded from our fiducial sample as outliers. These plots are used to define sample cuts only. Distances are based on the J-band photometry alone, with no corrections from these diagnostic parameters.
Current usage metrics show cumulative count of Article Views (full-text article views including HTML views, PDF and ePub downloads, according to the available data) and Abstracts Views on Vision4Press platform.
Data correspond to usage on the plateform after 2015. The current usage metrics is available 48-96 hours after online publication and is updated daily on week days.
Initial download of the metrics may take a while.