Fig. 6
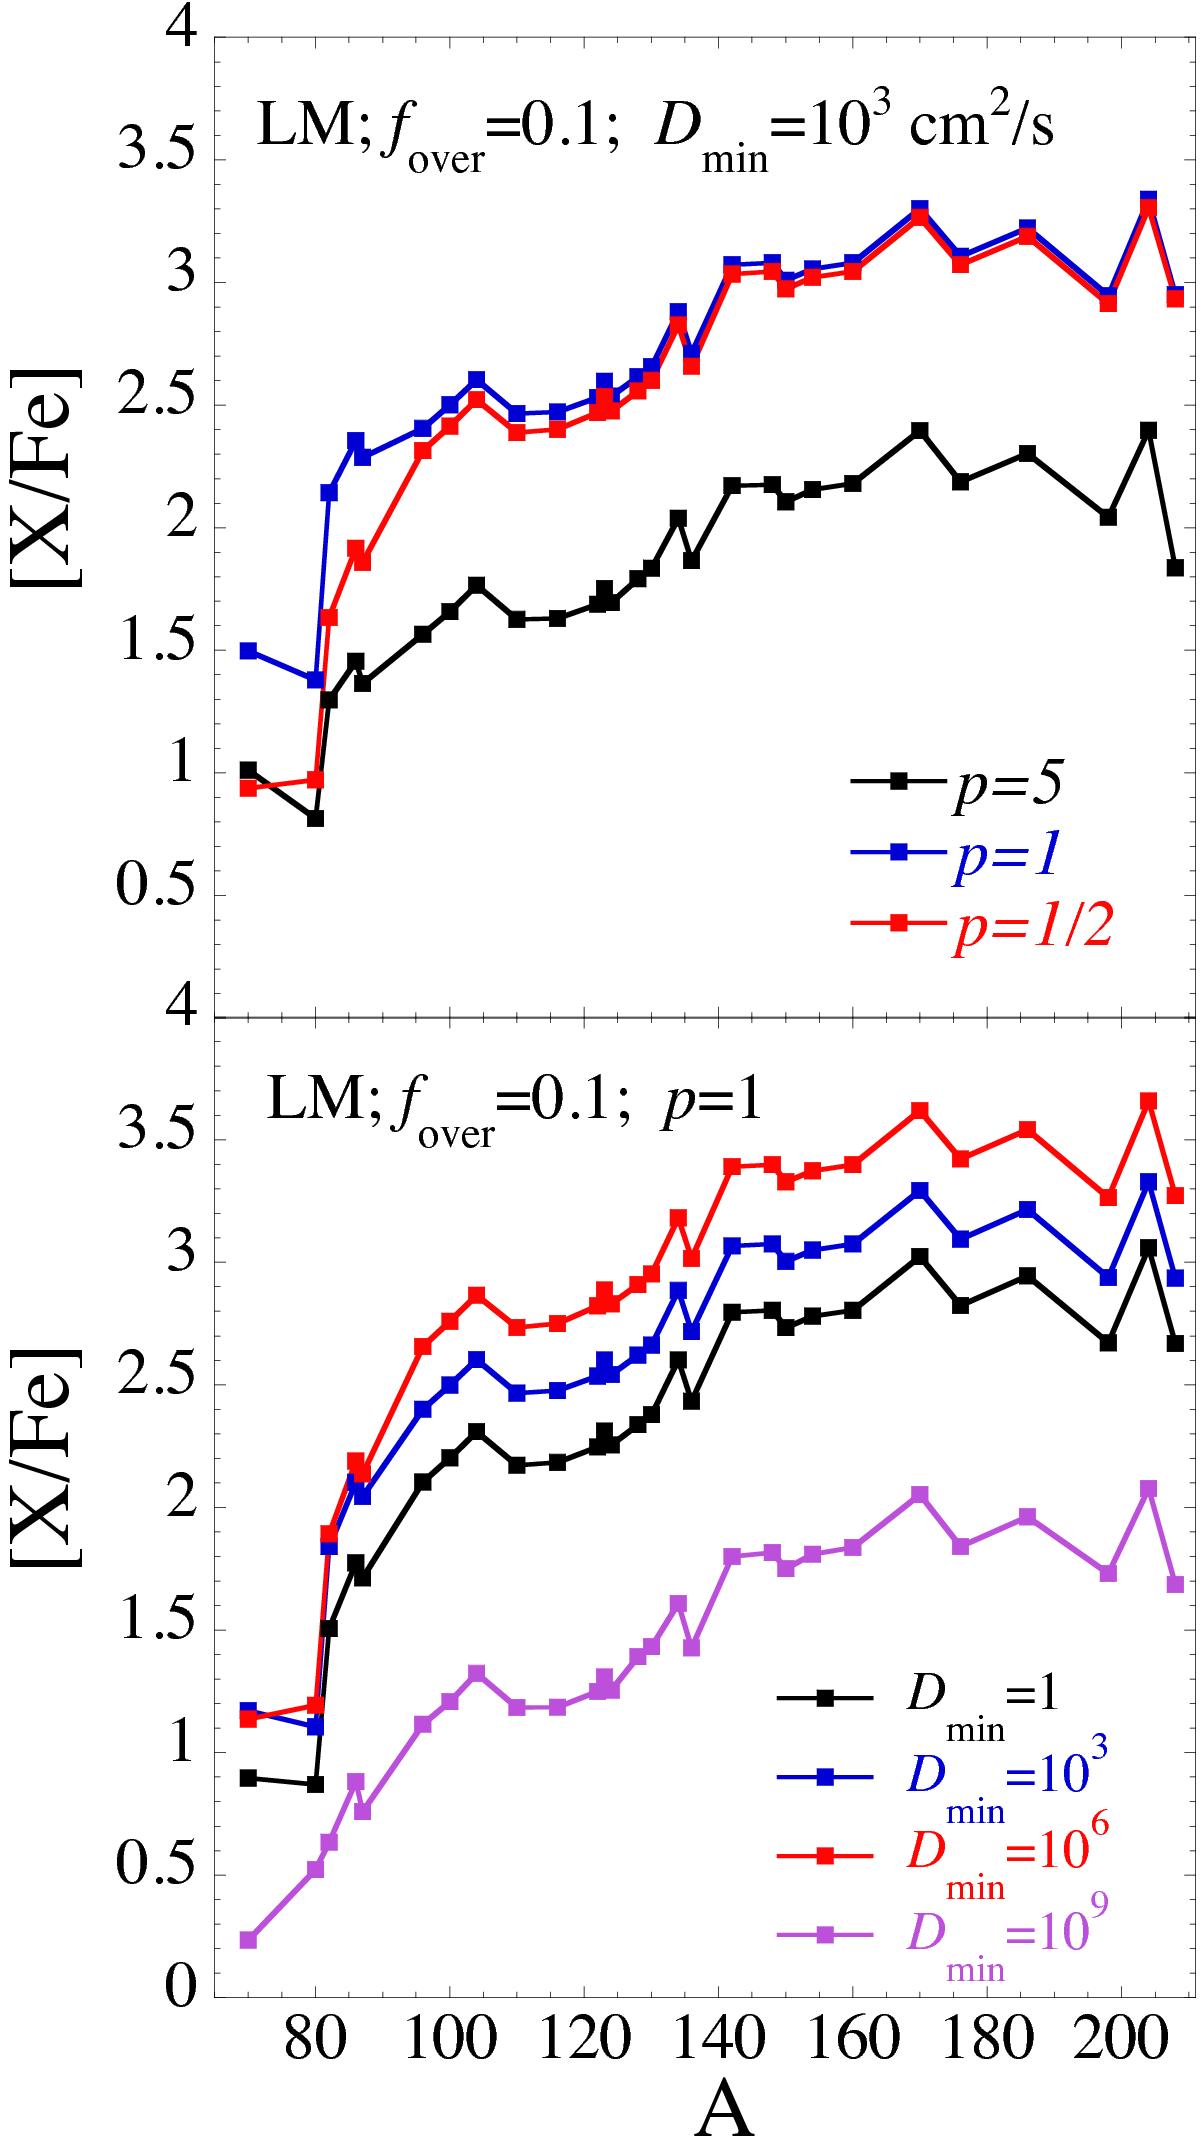
Overabundance distributions [X/Fe] for the 28 s-only nuclei inside a region of 0.01 M⊙ around Mr = 0.595−0.605M⊙ at the end of the 8th interpulse of our 2 M⊙[Fe/H] = −0.5 model star. The results are shown for different LM conditions, i.e. different values of p (upper panel) or Dmin (in cm2/s; lower panel); in all cases, fover = 0.1 is assumed.
Current usage metrics show cumulative count of Article Views (full-text article views including HTML views, PDF and ePub downloads, according to the available data) and Abstracts Views on Vision4Press platform.
Data correspond to usage on the plateform after 2015. The current usage metrics is available 48-96 hours after online publication and is updated daily on week days.
Initial download of the metrics may take a while.