Fig. B.1
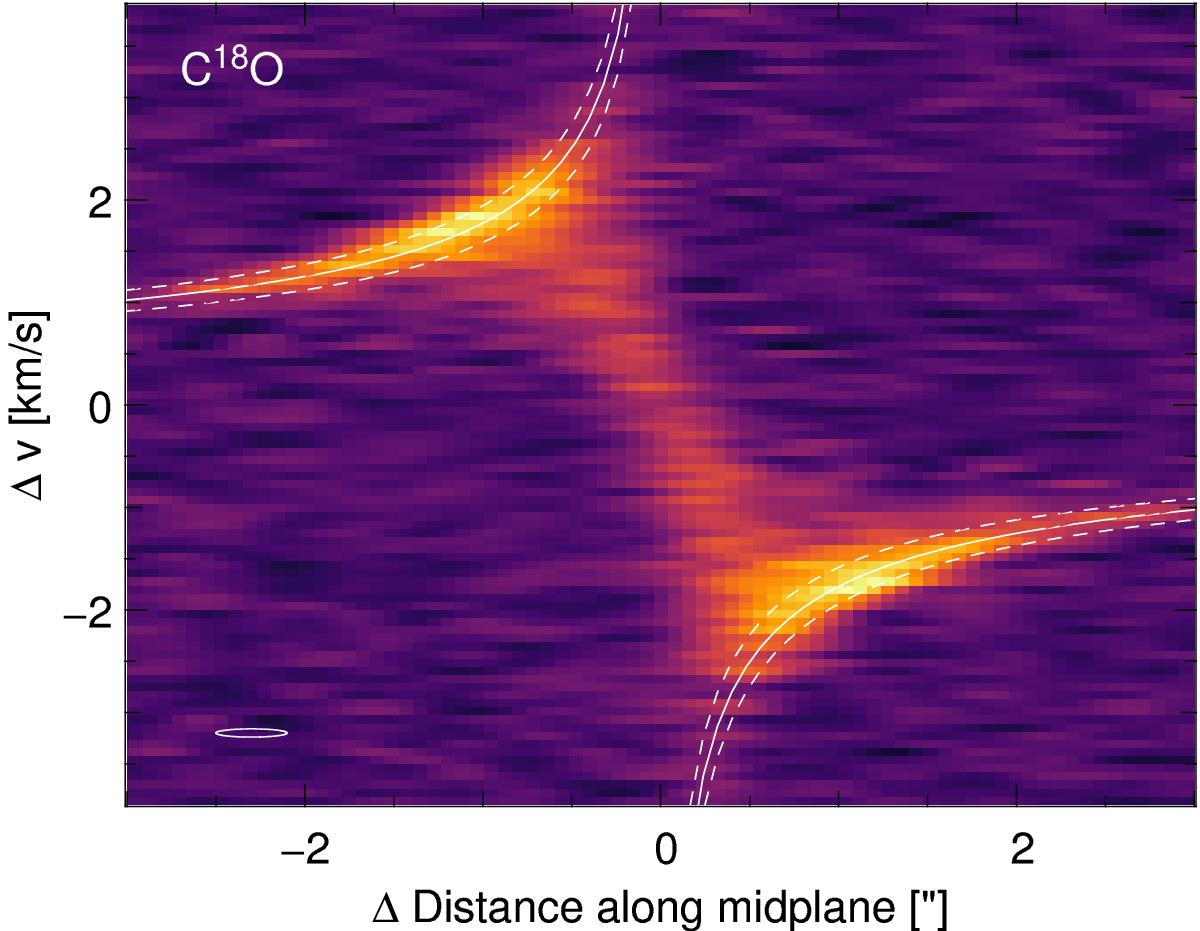
Position–velocity diagram of the continuum subtracted C18O line along the disc major axis. The Δv is relative to the systemic velocity of 4.5 km s-1. The solid line shows the midplane Keplerian velocity for a stellar mass of 1 M⊙ and an inclination of 48°. The dashed lines correspond to stellar masses of 0.9 and 1.1 M⊙. The data have been spectrally smoothed to a resolution of 80 m s-1. The spectro-spatial resolution is indicated in the lower left corner.
Current usage metrics show cumulative count of Article Views (full-text article views including HTML views, PDF and ePub downloads, according to the available data) and Abstracts Views on Vision4Press platform.
Data correspond to usage on the plateform after 2015. The current usage metrics is available 48-96 hours after online publication and is updated daily on week days.
Initial download of the metrics may take a while.