Fig. 4
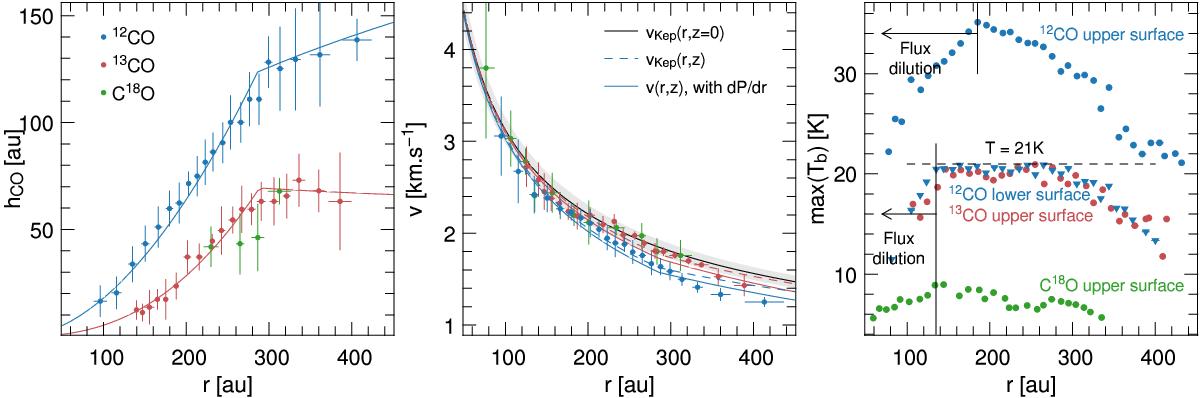
Measured altitude, velocity, and brightness temperature of the CO layers as a function of radius: 12CO (blue), 13CO (red), and C18O (green). Data points were extracted for all channel maps and binned according to distance. The error bars represent the dispersion within the bins added quadratically to the uncertainty resulting from inclination (48 ± 3°). Left: solid lines display a broken power-law fit (below and above r = 300 au) for the 12CO and 13CO. Centre: black solid line represents the Keplerian velocity for a 1 M⊙ central star, derived from the C18O position-velocity diagram (Appendix A). The shaded area represents an uncertainty of 0.1 M⊙. The red and blue dashed lines show the expected Keplerian velocities taking into account the altitude of the 12CO and 13CO layers. The red and blue solid lines display the velocity of the 12CO and 13CO layers taking into account the altitude and the pressure gradient term, as derived from our MCFOST model. Right: circles and triangles represent the temperature measured on the upper and lower surfaces, respectively. The brightness temperatures are similar on the upper and lower surfaces for 13CO and C18O; for clarity, only the upper surface is plotted.
Current usage metrics show cumulative count of Article Views (full-text article views including HTML views, PDF and ePub downloads, according to the available data) and Abstracts Views on Vision4Press platform.
Data correspond to usage on the plateform after 2015. The current usage metrics is available 48-96 hours after online publication and is updated daily on week days.
Initial download of the metrics may take a while.