Fig. 5
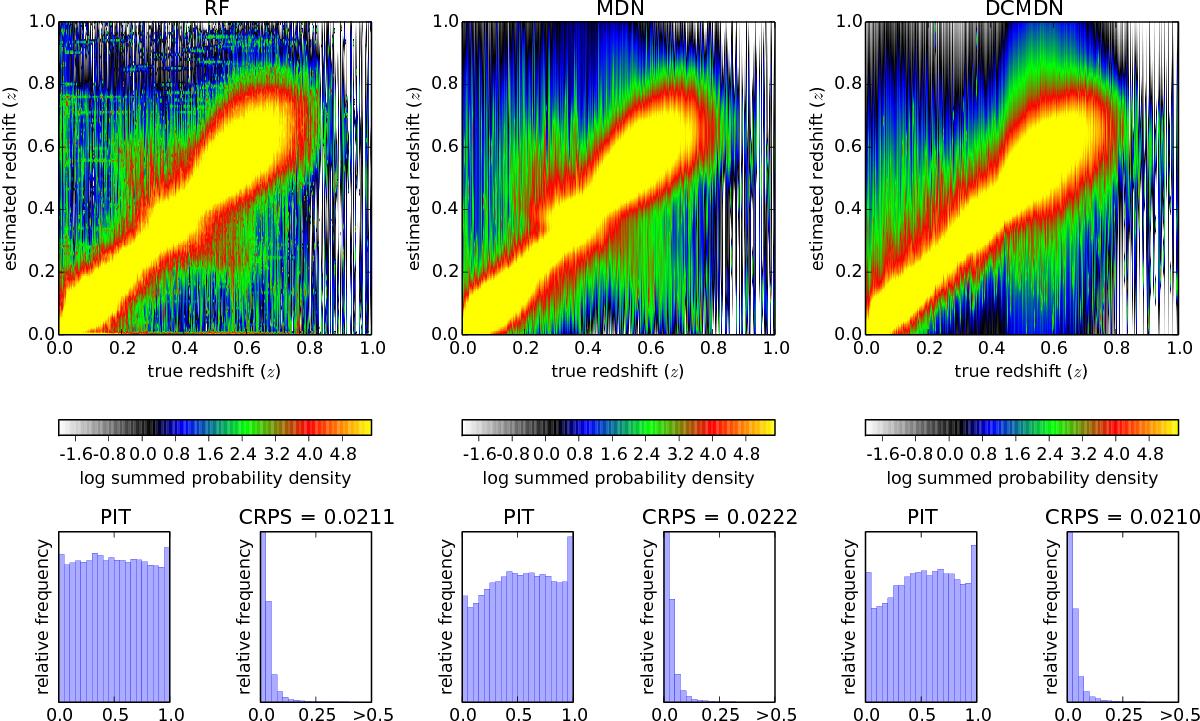
Results of Experiment 1 (galaxies) with a fully probabilistic evaluation and representation of the estimated PDFs. For each model, three plots are present. In the upper one, the predicted density distribution for each individual object is plotted at the corresponding spectroscopic redshift. The colors hereby indicate the logarithm of the summed probability densities using 500 redshift bins per axis. In the two lower plots, the histogram of the PIT values and the histogram of the CRPS values are shown, respectively. The mean CRPS values are reported, too.
Current usage metrics show cumulative count of Article Views (full-text article views including HTML views, PDF and ePub downloads, according to the available data) and Abstracts Views on Vision4Press platform.
Data correspond to usage on the plateform after 2015. The current usage metrics is available 48-96 hours after online publication and is updated daily on week days.
Initial download of the metrics may take a while.