Fig. C.1
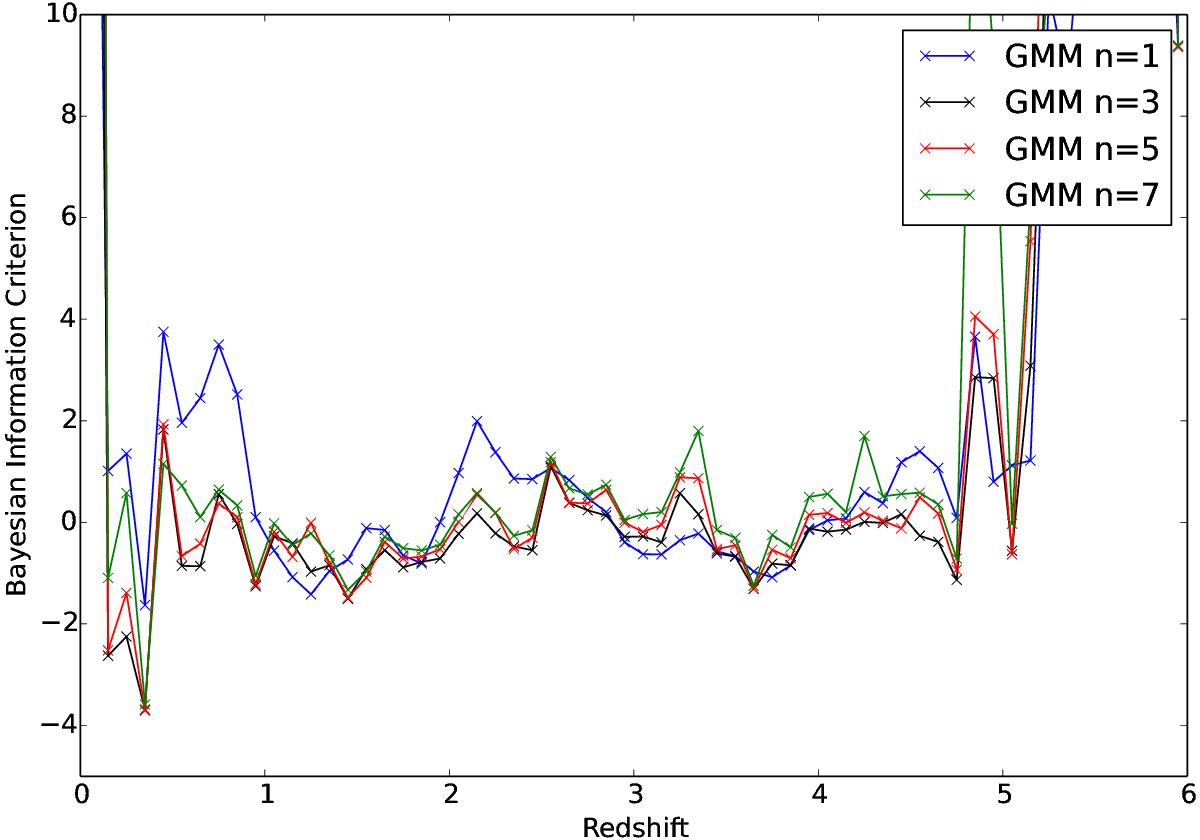
Distribution of the mean Bayesian information criterion score, with respect to redshift and number of Gaussian components. The plot depicts that different regions of the redshift range demand a different number of components. On average, the use of n = 5 is a reasonable choice. The experiment is performed using the RF and the quasar data-set.
Current usage metrics show cumulative count of Article Views (full-text article views including HTML views, PDF and ePub downloads, according to the available data) and Abstracts Views on Vision4Press platform.
Data correspond to usage on the plateform after 2015. The current usage metrics is available 48-96 hours after online publication and is updated daily on week days.
Initial download of the metrics may take a while.