Fig. A.1
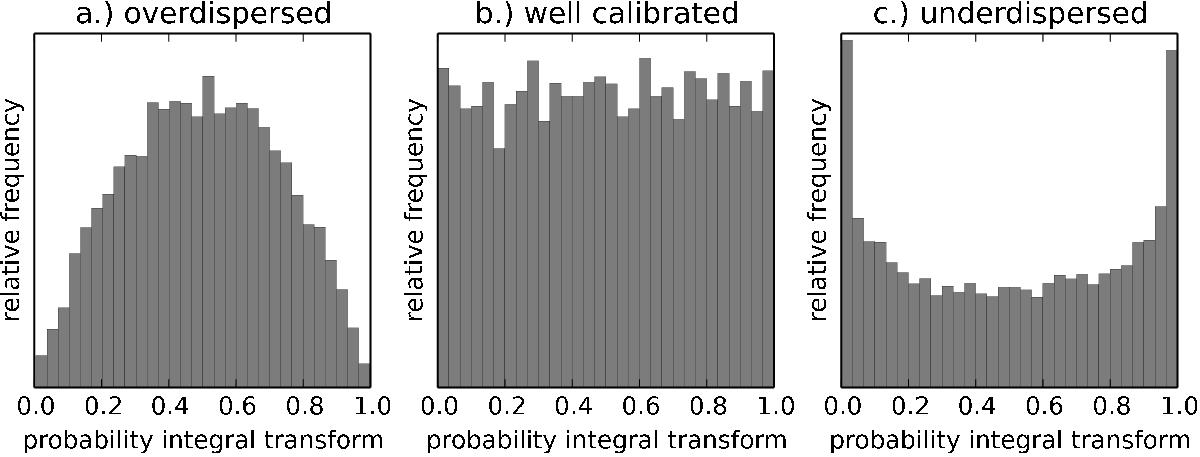
Visual guide to the usage of a PIT. In case the estimated PDFs are to broad with respect to the position of the true value, a convex histogram with a peak in the center can be observed (a). As soon as the predicted densities are too narrow, the evaluation of the CDF at the true redshift exhibits in most cases just very low and very high values. Therefore a concave, U-shaped histogram will be produced (c). Only in the case where the widths of the predicted densities is in accordance with the deviations from the true measurements, a uniformly distributed histogram is generated (b). This indicates sharp and well calibrated predictions.
Current usage metrics show cumulative count of Article Views (full-text article views including HTML views, PDF and ePub downloads, according to the available data) and Abstracts Views on Vision4Press platform.
Data correspond to usage on the plateform after 2015. The current usage metrics is available 48-96 hours after online publication and is updated daily on week days.
Initial download of the metrics may take a while.