Fig. 4
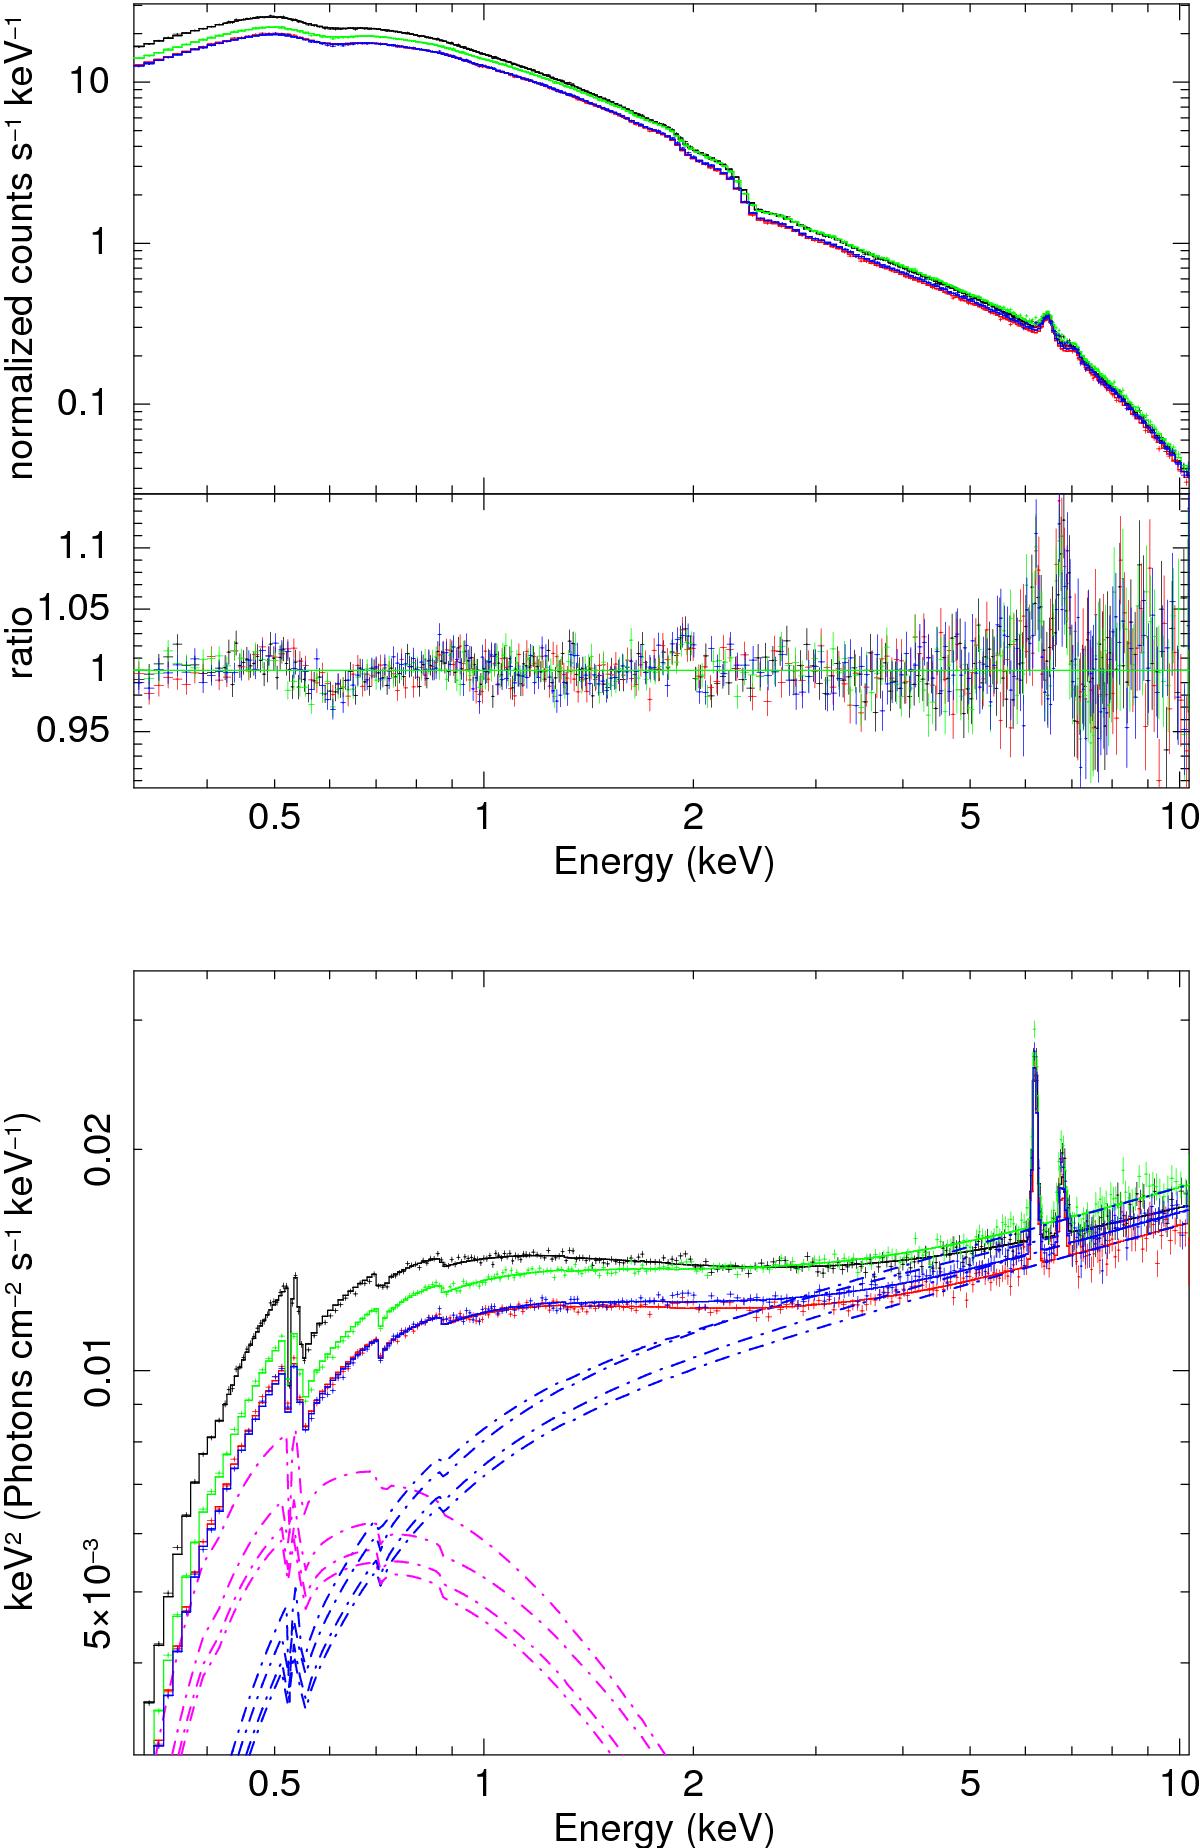
Fit over the 0.3–10 keV energy range of the four 2014 XMM-Newton/pn spectra with the baseline Comptonization model (model ℬ). The fit parameters are reported in Table 4. Black: March 18, red: March 20, green: March 22, and blue: March 24. Top panel: data and data/model ratio. Bottom panel: unfolded spectra where the contributions of the model components are displayed. The following color code for the emission components (dot-dashed curves) is used: magenta for the soft Comptonization (comptt), blue for the cut-off power-law (hot Comptonization). For clarity purposes, we have not displayed the Fe K line components.
Current usage metrics show cumulative count of Article Views (full-text article views including HTML views, PDF and ePub downloads, according to the available data) and Abstracts Views on Vision4Press platform.
Data correspond to usage on the plateform after 2015. The current usage metrics is available 48-96 hours after online publication and is updated daily on week days.
Initial download of the metrics may take a while.