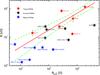
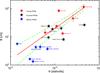
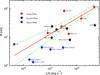
Fig. 4
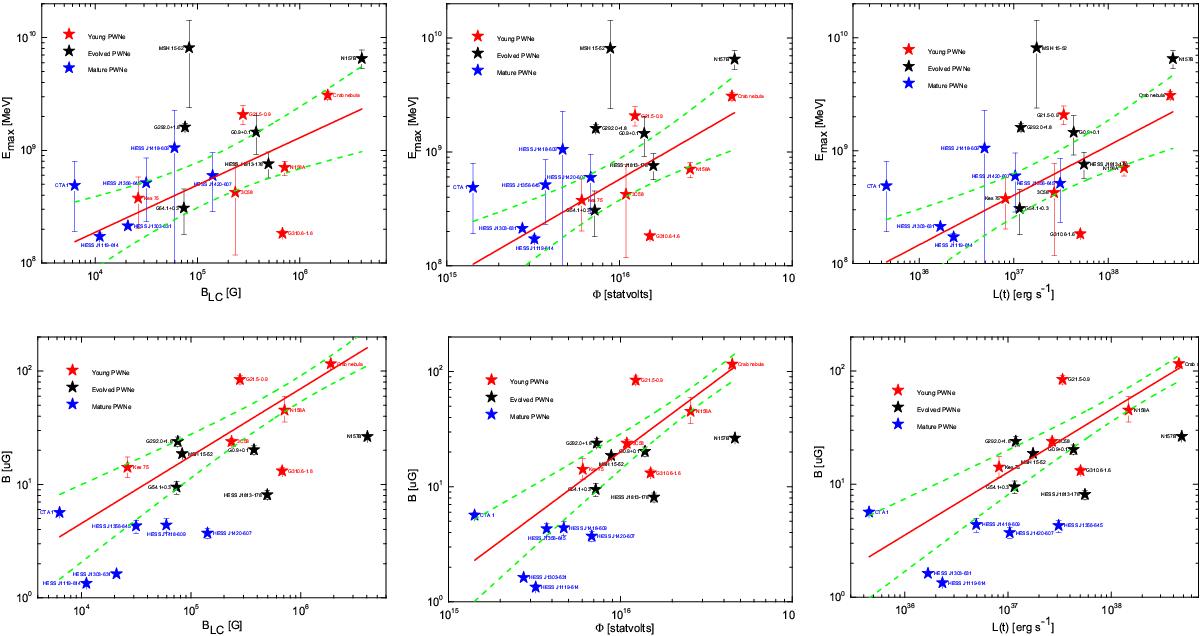
Correlations between Emax (upper panels) and Bpwn (bottom panels) and pulsar parameters BLC, Φ, and L(t). The solid lines represent the best linear fits (from top left to bottom right): log Emax = (0.42 ± 0.10)log BLC + (6.59 ± 0.54), log Emax = (0.88 ± 0.19)log Φ−(5.31 ± 2.97), log Emax = (0.44 ± 0.09)log L(t)−(7.65 ± 3.46), log Bpwn = (0.59 ± 0.08)log BLC−(1.72 ± 0.47), log Bpwn = (1.11 ± 0.12)log Φ−(16.47 ± 2.04), and log Bpwn = (0.56 ± 0.06)log L(t)−(19.44 ± 2.42); the correlation coefficient r = 0.71, 0.76, 0.76, 0.88, 0.91, and 0.91; and the probability of the null hypothesis Pnull = 8.95 × 10-4,2.26 × 10-4,2.24 × 10-4,1.14 × 10-6,1.23 × 10-7, and 1.71 × 10⁻⁷. The dashed lines are the 2σ confidence bands for the sample.
Current usage metrics show cumulative count of Article Views (full-text article views including HTML views, PDF and ePub downloads, according to the available data) and Abstracts Views on Vision4Press platform.
Data correspond to usage on the plateform after 2015. The current usage metrics is available 48-96 hours after online publication and is updated daily on week days.
Initial download of the metrics may take a while.