Fig. 3
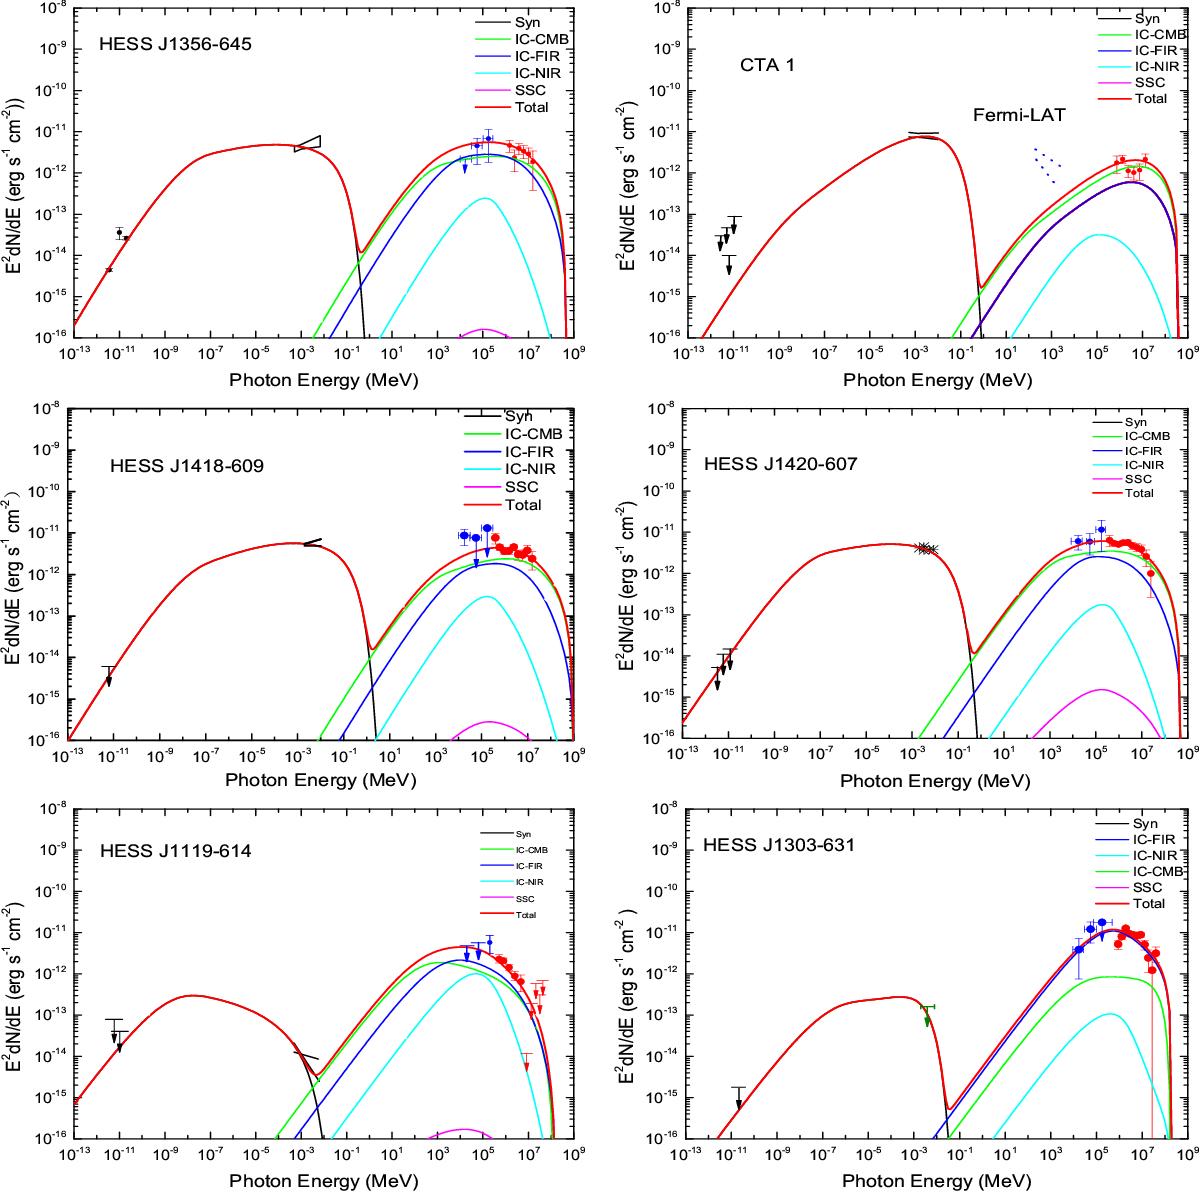
Comparisons of predicted SEDs and observed data for mature/old PWNe (from upper left panel for HEES J1356-645 to bottom right panel for HESS J1303-631). In each panel, the black line represents the synchrotron SED; magenta, blue, green, and cyan lines represent the SEDs of inverse Compton scatterings with the synchrotron photons, IR, CMB, and starlight, respectively; and the total SED is shown by the red line. See text for the descriptions of the observed data; the relevant parameters are listed in Table 3.
Current usage metrics show cumulative count of Article Views (full-text article views including HTML views, PDF and ePub downloads, according to the available data) and Abstracts Views on Vision4Press platform.
Data correspond to usage on the plateform after 2015. The current usage metrics is available 48-96 hours after online publication and is updated daily on week days.
Initial download of the metrics may take a while.