Fig. 10
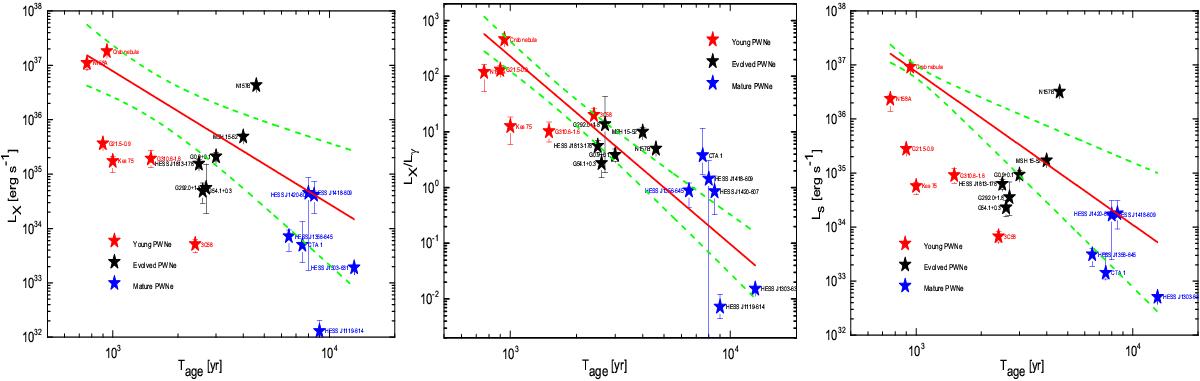
Correlations between Tage and LX, LX/Lγ, and Ls. The solid lines are the best linear fits, which are log LX = −(2.44 ± 0.59)log Tage + (44.23 ± 1.89), log LX/Lγ = −(3.37 ± 0.29)log Tage + (12.47 ± 0.94), and log Ls = −(2.83 ± 0.53)log Tage + (45.37 ± 1.59); the correlation coefficients r = 0.72, 0.95, and 0.80; and the probability of the null hypothesis Pnull = 7.81 × 10-4,3.15 × 10-9, and 7.22 × 10⁻⁵. The dashed lines are the 2σ confidence bands for the sample.
Current usage metrics show cumulative count of Article Views (full-text article views including HTML views, PDF and ePub downloads, according to the available data) and Abstracts Views on Vision4Press platform.
Data correspond to usage on the plateform after 2015. The current usage metrics is available 48-96 hours after online publication and is updated daily on week days.
Initial download of the metrics may take a while.