Fig. 4
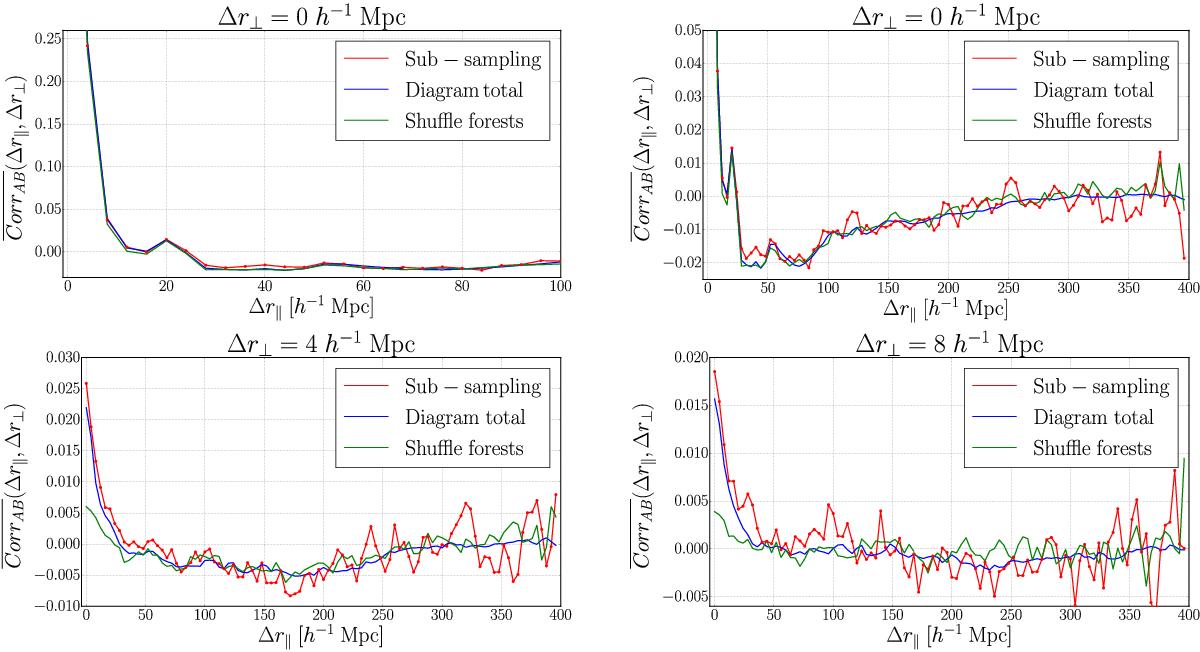
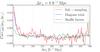
Mean normalized covariance matrix, Corr![]() , as a function of
, as a function of ![]() for the three lowest values of
for the three lowest values of ![]() . The top figures are for Δr⊥ = 0, with the righthand panel showing only points with CorrAB< 0.1. The bottom two figures are for Δr⊥ = 4 h-1 Mpc (left) and Δr⊥ = 8 h-1 Mpc (right). Shown are the correlations given by the sub-sampling, by the sum of all the diagram expansion, and by the shuffle of forests. The shuffle technique fails for (Δr⊥> 0,Δr∥< 30 h-1 Mpc) where inter-forest correlations dominate.
. The top figures are for Δr⊥ = 0, with the righthand panel showing only points with CorrAB< 0.1. The bottom two figures are for Δr⊥ = 4 h-1 Mpc (left) and Δr⊥ = 8 h-1 Mpc (right). Shown are the correlations given by the sub-sampling, by the sum of all the diagram expansion, and by the shuffle of forests. The shuffle technique fails for (Δr⊥> 0,Δr∥< 30 h-1 Mpc) where inter-forest correlations dominate.
Current usage metrics show cumulative count of Article Views (full-text article views including HTML views, PDF and ePub downloads, according to the available data) and Abstracts Views on Vision4Press platform.
Data correspond to usage on the plateform after 2015. The current usage metrics is available 48-96 hours after online publication and is updated daily on week days.
Initial download of the metrics may take a while.