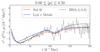
Fig. A.3
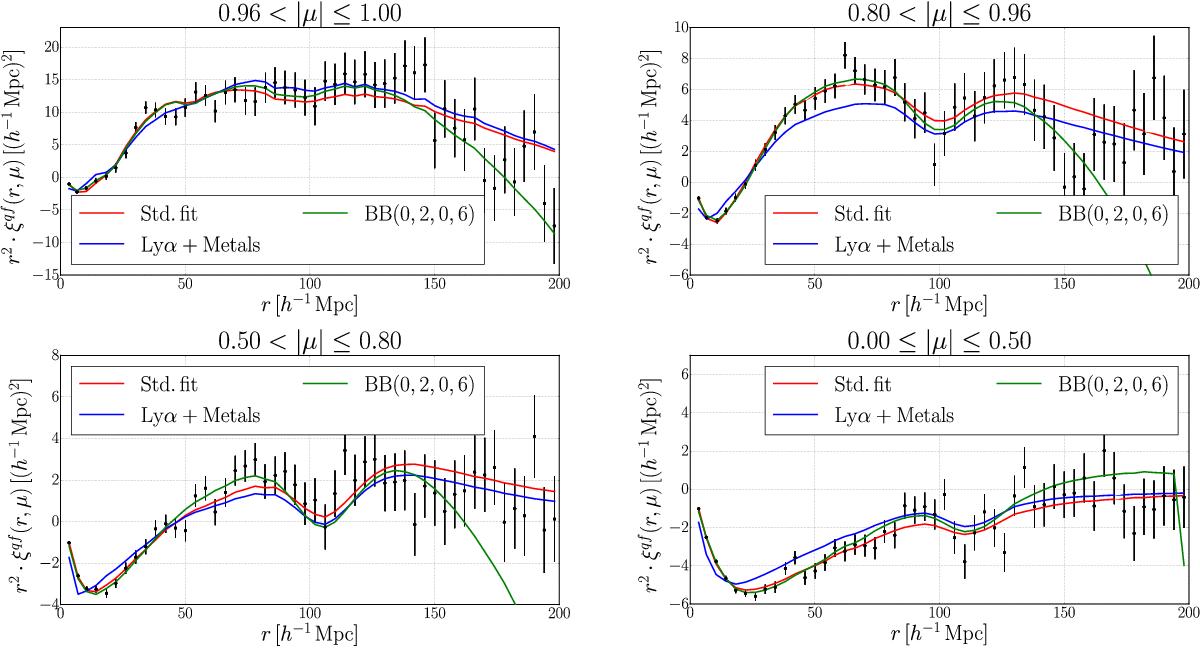
As in Fig. 6 but showing three models fit to the data. Red lines indicate the standard fit used to measure the BAO parameters (Sect. 5.2), blue lines the standard fit if the velocity distribution of quasars was null, and green lines the standard fit with the addition of a broadband defined by (33) with (imin,imax,jmin,jmax) = (0,2,0,6). The cross-correlation is multiplied by a factor r2 to show the BAO scale.
Current usage metrics show cumulative count of Article Views (full-text article views including HTML views, PDF and ePub downloads, according to the available data) and Abstracts Views on Vision4Press platform.
Data correspond to usage on the plateform after 2015. The current usage metrics is available 48-96 hours after online publication and is updated daily on week days.
Initial download of the metrics may take a while.