Fig. A.2
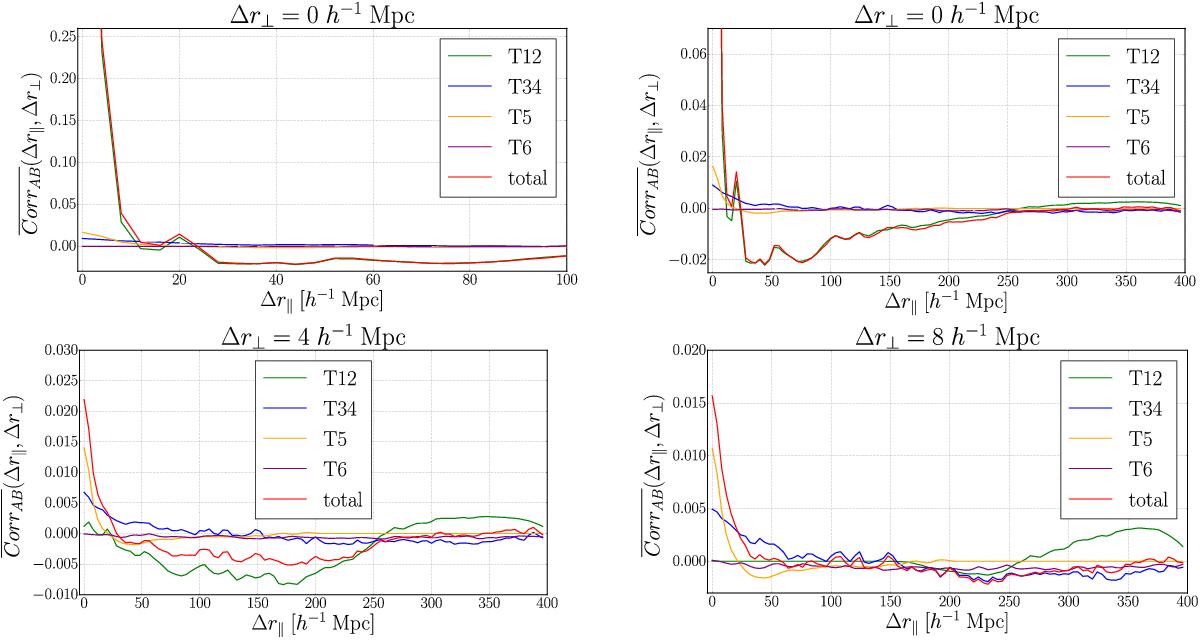
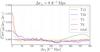
Mean normalized covariance matrix of the data, Corr![]() as a function of
as a function of ![]() for the smallest values of
for the smallest values of ![]() . The top panels are for Δr⊥ = 0 with the right panel displaying only the points with CorrAB< 0.1. The bottom panels are for Δr⊥ = 4 h-1 Mpc (left) and Δr⊥ = 8 h-1 Mpc (right). Shown are the correlations given by each diagram: T12 (green), T34 (blue), T5 (yellow), and T6 (purple), along with the sum of all the diagrams (red).
. The top panels are for Δr⊥ = 0 with the right panel displaying only the points with CorrAB< 0.1. The bottom panels are for Δr⊥ = 4 h-1 Mpc (left) and Δr⊥ = 8 h-1 Mpc (right). Shown are the correlations given by each diagram: T12 (green), T34 (blue), T5 (yellow), and T6 (purple), along with the sum of all the diagrams (red).
Current usage metrics show cumulative count of Article Views (full-text article views including HTML views, PDF and ePub downloads, according to the available data) and Abstracts Views on Vision4Press platform.
Data correspond to usage on the plateform after 2015. The current usage metrics is available 48-96 hours after online publication and is updated daily on week days.
Initial download of the metrics may take a while.