Fig. A.1
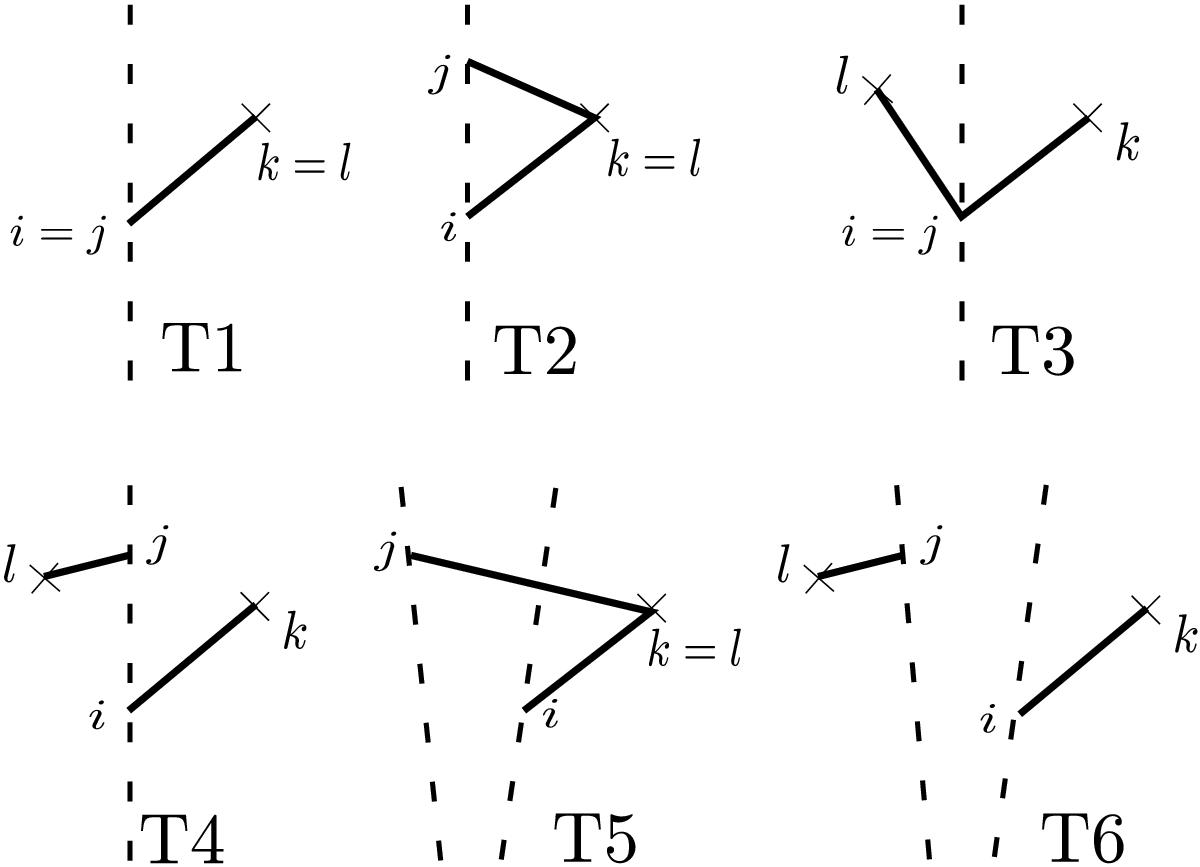
Six different diagrams of pairs of pixel-quasar pairs. The dashed lines refer to the forests, the crosses refer to the quasar position. The variance is dominated by T1 and T2. The off-diagonal terms of the covariance are dominated by T2. The diagrams T3 and T4 cancel out at large scale, the diagram T5 has a small contribution at small scales and T6 is negligible.
Current usage metrics show cumulative count of Article Views (full-text article views including HTML views, PDF and ePub downloads, according to the available data) and Abstracts Views on Vision4Press platform.
Data correspond to usage on the plateform after 2015. The current usage metrics is available 48-96 hours after online publication and is updated daily on week days.
Initial download of the metrics may take a while.