Fig. 12
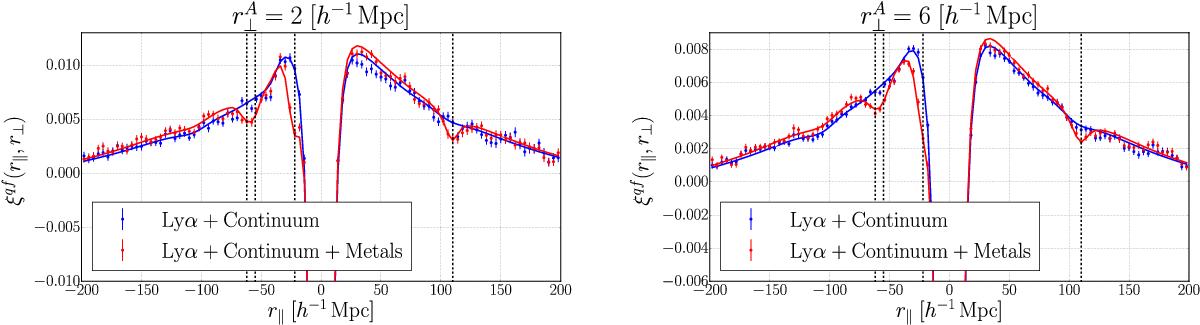
Stack of the 100 mocks cross-correlation for two different ranges of r⊥ with the points representing the reconstructed correlation function and the lines representing the fit correlation function (over the range 10 <r< 160 h-1 Mpc). Blue and red represent the Lyα+Continuum type and Lyα+Continuum+Metals types, respectively. The four black dashed lines indicate the positions of the four peaks of the metal-quasar correlations. The trough at r∥ ≈ −60 h-1 Mpc is due to the SiII(119.3)- and SiII(119.0)-quasar cross-correlations, at r∥ ≈ −21 h-1 Mpc to the SiIII(120.7)-quasar cross-correlation, and at r∥ ≈ + 103 h-1 Mpc to the SiIII(126.0)-quasar cross-correlation.
Current usage metrics show cumulative count of Article Views (full-text article views including HTML views, PDF and ePub downloads, according to the available data) and Abstracts Views on Vision4Press platform.
Data correspond to usage on the plateform after 2015. The current usage metrics is available 48-96 hours after online publication and is updated daily on week days.
Initial download of the metrics may take a while.