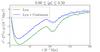
Fig. 11
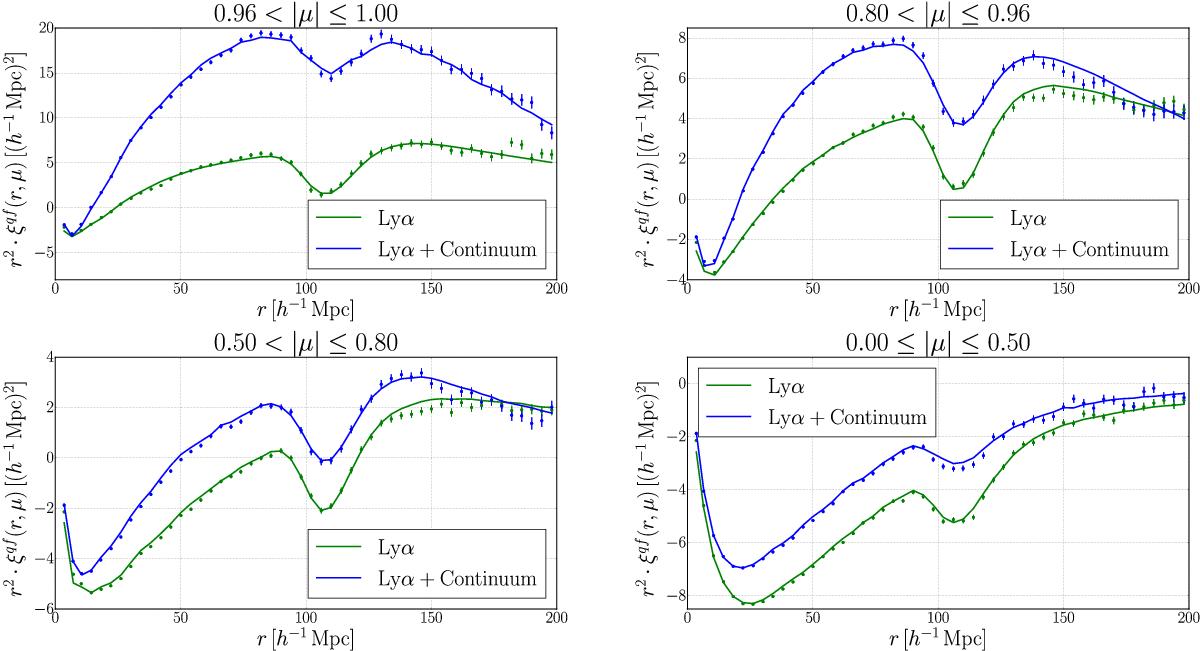
Cross-correlation of the stack of the 100 mocks in four bins of μ = r∥/r, with the points representing the reconstructed correlation function and the lines representing the fit correlation function (over the range 10 <r< 160 h-1 Mpc). Green and blue represent the Lyα and Lyα+Continuum types, respectively. The agreement between lines and points indicates that the distortion due to continuum fitting is well modeled by the distortion matrix DAA′ (12). The cross-correlation is multiplied by a factor r2 to show the BAO scale.
Current usage metrics show cumulative count of Article Views (full-text article views including HTML views, PDF and ePub downloads, according to the available data) and Abstracts Views on Vision4Press platform.
Data correspond to usage on the plateform after 2015. The current usage metrics is available 48-96 hours after online publication and is updated daily on week days.
Initial download of the metrics may take a while.