| Issue |
A&A
Volume 608, December 2017
|
|
|---|---|---|
| Article Number | A71 | |
| Number of page(s) | 11 | |
| Section | Planets and planetary systems | |
| DOI | https://doi.org/10.1051/0004-6361/201731527 | |
| Published online | 08 December 2017 | |
High signal-to-noise spectral characterization of the planetary-mass object HD 106906 b⋆,⋆⋆
1 ETH Zürich, Institut für Astronomie, Wolfgang-Pauli-Strasse 27, 8093 Zürich, Switzerland
e-mail: This email address is being protected from spambots. You need JavaScript enabled to view it.
2 Anton Pannekoek Institute for Astronomy, University of Amsterdam, Science Park 904, 1098 XH Amsterdam, The Netherlands
3 Department of Astronomy, University of Michigan, 1085 S. University, Ann Arbor, MI 48109, USA
4 Physikalisches Institut, Universität Bern, Gesellschaftstrasse 6, 3012 Bern, Switzerland
5 Department of Astronomy & Astrophysics, 1156 High Street, University of California, Santa Cruz, CA 95064, USA
Received: 7 July 2017
Accepted: 17 August 2017
Abstract
Context. Directly imaged planets are ideal candidates for spectroscopic characterization of their atmospheres. The angular separations that are typically close to their host stars, however, reduce the achievable contrast and thus signal-to-noise ratios (S/N).
Aims. We spectroscopically characterize the atmosphere of HD 106906 b, which is a young low-mass companion near the deuterium burning limit. The wide separation from its host star of 7.1′′ makes it an ideal candidate for high S/N and high-resolution spectroscopy. We aim to derive new constraints on the spectral type, effective temperature, and luminosity of HD 106906 b and also to provide a high S/N template spectrum for future characterization of extrasolar planets.
Methods. We obtained 1.1−2.5 μm integral field spectroscopy with the VLT/SINFONI instrument with a spectral resolution of R ≈ 2000–4000. New estimates of the parameters of HD 106906 b are derived by analyzing spectral features, comparing the extracted spectra to spectral catalogs of other low-mass objects, and fitting with theoretical isochrones.
Results. We identify several spectral absorption lines that are consistent with a low mass for HD 106906 b. We derive a new spectral type of L1.5 ± 1.0, which is one subclass earlier than previous estimates. Through comparison with other young low-mass objects, this translates to a luminosity of log(L/L⊙) = −3.65 ± 0.08 and an effective temperature of Teff = 1820 ± 240 K. Our new mass estimates range between M = 11.9-0.8+1.7 MJup (hot start) and M = 14.0-0.5+0.2 MJup (cold start). These limits take into account a possibly finite formation time, i.e., HD 106906 b is allowed to be 0−3 Myr younger than its host star. We exclude accretion onto HD 106906 b at rates Ṁ > 4.8 × 10⁻¹⁰ MJup yr-1 based on the fact that we observe no hydrogen (Paschen-β, Brackett-γ) emission. This is indicative of little or no circumplanetary gas. With our new observations, HD 106906 b is the planetary-mass object with one of the highest S/N spectra yet. We make the spectrum available for future comparison with data from existing and next-generation (e.g., ELT and JWST) spectrographs.
Key words: planets and satellites: individual: HD 106906 b / techniques: imaging spectroscopy
Fully reduced spectra are only available at the CDS via anonymous ftp to cdsarc.u-strasbg.fr (130.79.128.5) or via http://cdsarc.u-strasbg.fr/viz-bin/qcat?J/A+A/608/A71
Based on observations collected at the European Organisation for Astronomical Research in the Southern Hemisphere under ESO programme 094.C-0672(A).
© ESO, 2017
1. Introduction
Direct imaging has revealed more than a dozen planetary-mass companions around young stars (for a review see, e.g., Bowler 2016). Intermediate resolution (R ≳ 1000−2000) infrared spectroscopy of these objects reveals a large number of spectroscopic features that can be compared with those of free-floating objects of similar mass and/or temperature (e.g., brown dwarfs) as well as atmospheric models to constrain formation and early evolution scenarios. Owing to the mostly high contrast ratios and close separations to their host stars, however, only few planets have been studied spectroscopically at high signal-to-noise ratios (S/N). A prime candidate for further investigation is the HD 106906 AB+b system.
Observation summary.
HD 106906 is a close binary star (Lagrange et al. 2017) at a distance of 102.8 ± 2.5 pc (Gaia Collaboration 2016) in the Lower Centaurus Crux association (13 ± 2 Myr, Pecaut et al. 2012). This binary star is known to harbor a circumstellar disk extending to >500 AU with a large inner hole and a co-moving low-mass companion at a projected separation of 7.̋1 (~730 AU; Chen et al. 2005; Bailey et al. 2014; Kalas et al. 2015; Lagrange et al. 2016). Previous estimates of the temperature and mass of the companion, based on low-resolution 1−2.5 μm spectroscopy and 0.6−3.5 μm photometry, placed it in the planetary-mass regime (Teff = 1800 K, M = 11 ± 2 MJup; Bailey et al. 2014; Wu et al. 2016).
The large distance of HD 106906 b to its host has spawned discussion about its formation process. This close binary may either have formed like a star through gravitational collapse of a molecular cloud or it may have formed in the primary’s disk. The latter may have happened in situ or closer to the star and scattered to its current position through interaction with the central binary and/or other stars (e.g., Rodet et al. 2017). Alternatively, it may have formed around another star and was scattered into the system through a close encounter early in the history of the association (Parker & Quanz 2012).
We present here new high S/N infrared spectroscopy of HD 106906 b. The observation and data reduction are described in Sect. 2, determinations of spectral type, effective temperature, luminosity, and mass are presented in Sect. 3. We summarize the new findings and discuss their implications in Sect. 4.
2. Observations and data reduction
Observations of HD 106906 b were taken with the SINFONI integral field spectrograph on the Very Large Telescope between December 2014 and March 2015. The primary star HD 106906 (V = 7.8 mag), 7.̋1 from the target, served as natural guide star for the adaptive optics system. We obtained spectra in J (1.10−1.40 μm), H (1.45−1.85 μm), and Ks (1.95−2.45 μm) bands with a spatial pixel scale of 125 mas × 250 mas, resulting in a field of view of 8′′× 8′′ and a spectral resolution of R ≈ 2000−4000. Object (O) and sky (S) observations followed an OSSOOSS... pattern with a ~1−2′′ offset between the two positions. The object frames were randomly offset with respect to each other within a radius of ~1′′, always keeping the bright primary outside the field of view. Reference stars with spectral types between B3 and B9 for the correction of telluric absorption were observed close in time to each science observation with the same instrumental setup and at similar airmass. A summary of the observation details is given in Table 1.
Data reduction partly relies on the SINFONI pipeline (Ver. 2.7.0) in the esorex1 environment. We used the standard settings and workflow until one integral field data cube was reconstructed per exposure. This involves dark subtraction, flat fielding, distortion correction, and wavelength calibration. The sky frame closest in time, reduced in the same way, was subtracted from each science frame. Since sky frames were taken with a small spatial offset relative to the science frames, most of these frames contain an image of the science target close to the edge of the detector. In order to avoid over subtraction, some sky frames had to be rejected if their point spread function (PSF) overlapped with the science target. Subsequently, we replaced any pixels flagged by the pipeline as bad by an interpolation of the nearest 6 good pixels in spectral direction using a custom IDL routine. The resulting integral field spectroscopic cubes have 64 × 64 pixels2 along the spatial and 2202 pixels along the spectral direction.
We extracted 1D spectra from the 3D cubes with the procedure described in Daemgen et al. (2013), using apertures with radii identical to 0.8 times the full width at half maximum (FWHM) in each wavelength bin. The FWHM values were determined from Gaussian fits to the trace in the high spatial resolution direction of the cube. Larger apertures could not be used because of contamination of the sky frames with astrophysical sources close to the science target location. We investigated whether any systematic uncertainties are introduced by choosing a small extraction aperture. Using the standard star as a reference, we increased the aperture size from 0.8 to 4 ×FWHM and found variations of the extracted flux of <10% per pixel at all wavelengths. Because of the low S/N of the target object in each individual wavelength bin, determination of the centroid and FWHM as a function of wavelength use a 2D Gaussian fitting to the bright telluric standard star in every slice of the cube. The extracted trace was shifted to the location of the target by fitting a 2D Gaussian profile to the target PSF after averaging 20–100 slices of the cube in spectral dimension.
The telluric standard stars were reduced and extracted in the same way as the science observations, but with a larger aperture (4 ×FWHM), and divided by a blackbody curve according to their effective temperature (Table 1). Hydrogen absorption lines were replaced by straight lines along the continuum before dividing the science spectra by the tellurics.
 |
Fig. 1 Examples of individual, fully reduced, and sky-subtracted data cubes of HD 106906 b in J, H, and K band, median-collapsed in spectral direction. The bright region in the bottom right is created by the primary star just outside the field of view. Dark patches are visible where the sky image contains stars. An example aperture for the extraction of the spectra (r = 0.̋26) is superimposed on HD 106906 b on the K-band image in red. Panels show the full field of view of SINFONI (8 × 8′′); centering is subject to jitter offset. The color stretch is linear, the orientation of all panels as indicated in the Ks image. |
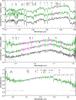 |
Fig. 2 Fully reduced and averaged spectra in J (top), H (middle), and Ks band (bottom) binned by a factor of 2. Green spectra show individual observing periods (most recent on top); black are averaged from all individual exposures per filter. Each spectrum has been normalized individually; offsets and flux scales are arbitrary. Regions highlighted in magenta may contain residual noise from the removal of absorption lines (mostly hydrogen) in the telluric standard. The wavelengths of some atomic and molecular absorption features of low-mass stellar objects are highlighted (Cushing et al. 2005). Regions of strong telluric absorption potentially causing residuals in the reduction are indicated by the black horizontal bars. |
Figure 1 shows spectral median images of one representative cube per filter. Extracted and averaged spectra are shown in Fig. 2. As can be seen in the top two panels of Fig. 2, we detect slight differences in the spectral slope of the continuum between the two observing epochs in J and H band, respectively. Normalized at the central wavelength in both filters, the amplitude of the variability at the band edges is ±~10%. This may be a consequence of the small extraction apertures or of variable telluric water absorption during the observations or a combination thereof. Variable telluric absorption might apply in particular to our second epoch H-band observation where the largest airmass difference between the science and telluric standard target occurred (Δairmass ~ 0.4). In addition, intrinsic spectral variability at this level has been previously observed for low-mass objects (e.g., Apai et al. 2013). Since we find no significant difference for any of the extracted parameters in Sect. 3 when analyzing the individual epochs, we average all exposures for each filter band and perform all measurements on the combined spectra. Uncertainties per spectral wavelength bin are calculated as the standard error of the mean between individual exposures of the same observing sequence. The measured S/Ns are S/N(J) ≈ 20/pixel, S/N(H) ≈ 20−50/pixel, and S/N(K) ≈ 20−40/pixel.
3. Analysis and results
3.1. Spectral characteristics
The spectra in Fig. 2 show the characteristic triangular shape of the H-band continuum, which is indicative of a young, low-mass, and low surface gravity object. Low gravity is quantitatively supported in the classification scheme by Allers & Liu (2013), which uses “gravity scores” based on spectral indices. Scores of 0, 1, and 2 identify objects with no, normal, and strong indications of low gravity, respectively. We measured FeH , K IJ = 1.06 ± 0.01, and H-cont =1.00 ± 0.02 resulting in gravity scores of 1, 1, and 2.
We see a large number of spectroscopic features that are likely caused by absorption through atoms and simple molecules in the atmosphere of HD 106906 b. The most prominent features are strong potassium lines between 1.15 μm and 1.3 μm as well as clearly detected carbon monoxide bands at ≳2.3 μm (Cushing et al. 2005). These are common features of low-mass objects. Weaker, but significantly detected features include sodium, magnesium, and calcium. The rest of the spectrum appears to be dominated by weaker absorption lines that are partly blended.
The equivalent widths Wλ = ∫(Fλ−Fc) /Fc dλ of a selection of strong (Wλ > 1 Å) features are listed in Table 2. The continuum Fc was measured with a quadratic polynomial fit to visually selected points along the continuum in regions devoid of strong absorption features. Polynomial fits to predefined sections of the spectrum, as used by Bonnefoy et al. (2014), did not lead to satisfactory fits of the continuum. Uncertainties of Wλ were obtained from the standard deviation of repeated measurements with different continuum fits following this recipe.
3.2. Spectral type
We determined the spectral type of HD 106906 b with three different methods: visual spectral comparisons (Sect. 3.2.1), spectral indices (Sect. 3.2.2), and examination of the Na I and K I equivalent widths (Sect. 3.2.3). Based on the inferred spectral types of L1.5–L2, L0.9 ± 0.6, and L0 ± 2, respectively, we calculated a spectral type of L1.7 ± 0.3 (inverse variance-weighted average). This value and its uncertainty is dominated by the visual inspection measurement. Given that we relied on the classifications by Allers & Liu (2013) and Bonnefoy et al. (2014), which themselves are subject to systematic and random uncertainties of typically 0.5 to 1 subclasses, we adopted a conservative uncertainty of 1 subclass for our best estimate. In the commonly used scheme of half subclasses we obtain L1.5 ± 1.0, which is our best estimate for the spectral type of HD 106906 b.
3.2.1. Visual inspection
We compared our JHK data to the spectral libraries from Allers & Liu (2013) and Bonnefoy et al. (2014), which present and characterize spectra of young late-type objects of low gravity. Allers & Liu (2013) examined 73 ultracool young (10–300 Myr) field dwarfs and classified these sources in a spectral type range of M5–L7. Their spectra have low (R ≈ 100) and medium resolution (R ≳ 750–2000). Bonnefoy et al. (2014) focused on a smaller sample of 15 young brown dwarfs mostly in the M6–L0 range. Their spectra were observed with the same instrument as used for our study (SINFONI) at equal spectral resolution in J band (R ≈ 2000) but slightly lower resolution in H and K (R ≈ 1500).
In Fig. 3 we compare our observed spectra to the library spectra. Because our spectra were not observed simultaneously and we cannot calibrate the flux of the H-band spectrum owing to an unknown H-band magnitude, we cannot obtain a reliable relative flux calibration of the full JHK spectrum. We thus compare each filter individually. For each comparison, our target spectrum has been convolved with a Gaussian profile to match the spectral resolution of the respective library spectrum. The individual results are listed in Table 3. Best fits range from M8 to L4. Based on the comparison from the Allers & Liu (2013) library, we classify the companion as a L1.5–L2, while the Bonnefoy et al. (2014) library suggests M8–L0. However, a caveat is that the latter library does not contain spectra with types L0.5−L3.5.
Equivalent widths of strong (Wλ > 1 Å) spectral features.
3.2.2. Spectral indices
In order to be consistent with previous studies, we adopted spectral indices that were used by Allers & Liu (2013) and Bonnefoy et al. (2014). Specifically, we explored the H2O index near 1.5 μm (Allers et al. 2007), H2O-1 (~1.3 μm), and H2O-2 (~2.1 μm) indices (Slesnick et al. 2004) and the H2OD index (~2.0 μm, McLean et al. 2003). Since the J band contains many spectral features from various molecules, we also examined the J band FeH spectral index (Slesnick et al. 2004), near 1.2 μm. The uncertainties of the best inferred value of L2.5 ± 1.9, however, extend beyond the valid spectral type range of M3–L3. Thus, we did not include these measurements in our final spectral type estimate.
Table 3 summarizes our results for each spectral index. Uncertainties were propagated from our measurement uncertainty and the quoted uncertainties of the polynomial fits in the original publications. Calculating the average of the spectral types determined using the H2O, H2O-1 and H2O-2 indices and weighing the average by the inverse of the square of their uncertainty, we get a spectral type of L0.9 ± 0.6.
3.2.3. Equivalent widths
Our spectra have a high S/N and a relatively high resolution. We can use the additional information contained in our data compared to, for example, Allers & Liu (2013) to improve our spectral type determination. We compare the equivalent widths of five J-band features of Na I (1.138 μm) and K I (1.169, 1.177, 1.243, and 1.253 μm; see Table 2) with those of other young objects as measured by Bonnefoy et al. (2014) at the same spectral resolution. We find that the equivalent widths are broadly consistent with an L0 ± 2 object. However, the correlation of spectral type with the Na I and K I equivalent widths of young object spectra such as those of HD 106906 b is weak and has a larger scatter compared to field objects, as is apparent from Fig. 11 in Bonnefoy et al. (2014). This diagnostic thus leads to less precise results than for field dwarfs. More independent determinations of precise equivalent widths and spectral types are needed to increase the usefulness of equivalent widths for spectral type determinations of young planetary-mass objects.
3.3. Effective temperature and luminosity
To obtain robust estimates of Teff and Lbol, we use two strategies. The first determination is based on our best spectral type estimate and uses empirical correlations of Teff and Lbol with spectral type for young late-type objects. The second approach derives a luminosity of HD 106906 b based on its brightness, empirically calibrated bolometric corrections, and the new Gaia distance, which is 10% larger than pre-Gaia estimates.
Our analysis is based on the analysis of colors, luminosities, and effective temperatures of 152 young brown dwarfs and directly imaged planets by Faherty et al. (2016). They have estimated Lbol by integrating the available SEDs for their sample of objects between 0 and 1000 microns. Since the distances to these objects are known, Faherty et al. have estimated radii using Lbol and model isochrones. Then, based on radius and Lbol, they have used the Stefan-Boltzmann law to calculate Teff. We mostly use the results from the Faherty et al. study as it supersedes the smaller young object sample by Filippazzo et al. (2015). The latter study, however, presents an analysis of a comparison sample of 65 field stars as well as bolometric corrections for young low-mass objects that are used in Sect. 3.3.2.
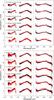 |
Fig. 3 Comparison of our spectra (black) with the libraries of young star spectra (red) by Allers & Liu (2013, and Bonnefoy et al. (2014, . The J, H, and K spectra have been normalized and matched for each band individually. |
3.3.1. Effective temperature
Faherty et al. (2016) have provided polynomial fits to the Lbol and Teff correlations with spectral type for three categories of low-gravity objects. First, their “YNG” sample contains all spectra with indications of low gravity. Second, the “YNG2” contains YNG as a subset, but also includes directly imaged planetary-mass objects. Third, the “GRP” sample contains confirmed young moving group targets. For our best estimate of the spectral type of HD 106906 b (L1.5 ± 1.0), we obtain  K,
K,  K, and
 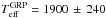 K. Uncertainties were derived from both the spectral type uncertainty and the rms of the spectral type-Teff relation by Faherty et al. (2016). The temperatures are in good agreement with each other and with the Bailey et al. value of Teff =1800 ± 100 K derived from evolutionary models. Since HD 106906 b is best described by the YNG2 sample, we adopt Teff = 1820 ± 240 K as our best estimate for its temperature.
This temperature is lower than what is obtained when assuming that HD 106906 b is a field object ( K). It is also slightly lower than the field object value derived by Bailey et al. (2014) of
  K based on their later spectral type of L2.5 ± 1. This is because similar to young brown dwarfs, planets are redder than field dwarfs in the near-infrared bands (e.g., Faherty et al. 2016); this is likely explained by high-altitude clouds (e.g., Bowler et al. 2010; Currie et al. 2011; Madhusudhan et al. 2011; Marley et al. 2012; Skemer et al. 2012).
3.3.2. Luminosity
Using the polynomial fits to the empirical luminosity-spectral type relations derived by Faherty et al. (2016), we calculate values of  ,
,  , and
, and  . Uncertainties, as estimated from a Monte Carlo simulation, take into account the spectral type uncertainty and the rms in log L (Faherty et al. 2016). Again, we select YNG2 as the most appropriate value and listed the others to illustrate the range of answers depending on the underlying sample.
Spectral type estimation.
For an independent estimate of the luminosity we also use bolometric corrections of young stars for the J band and Ks band, respectively. These are available through polynomial fits to the YNG sample of Filippazzo et al. (2015). With bolometric corrections for the HD 106906 b J and Ks magnitudes of BCJ = 1.54 ± 0.28 mag and BCKs = 3.27 ± 0.13 mag, we derive luminosities of  and
and  calculated as
  (1)using Mbol, ⊙ = 4.74 mag. Uncertainties were propagated using a Monte Carlo simulation based on the rms values reported by Filippazzo et al. (2015, ΔBCKs = 0.126 mag, ΔBCJ = 0.189 as well as the uncertainties of the distance modulus and our spectral type estimate. The comparably faint luminosity derived from the J-band corrections is due to a red J−Ks color, compared to atmospheric models and other targets of this spectral type, which was already observed by Wu et al. (2016).
From the three estimates ( ,
,  , and
, and  ) we derive log (Lbol/L⊙) = −3.65 ± 0.08 as our best estimate of the bolometric luminosity of HD 106906 b using a Monte Carlo simulation to propagate the uncertainties.
3.4. Mass
We used stellar evolution models to translate our inferred luminosity to mass. Model families include DUSTY (Chabrier et al. 2000), BT-Settl (Baraffe et al. 2015), and the Bern Exoplanet Tracks (BEX). The first two feature dusty atmospheres and are classified as “hot start” according to their high initial (i.e., post-formation) entropies. The BEX use initial entropies found in self-consistently coupled planet formation and evolution simulations (Mordasini et al. 2012). The models were updated to employ Ames Cond atmospheric boundary conditions (Allard et al. 2001) and include deuterium burning (Mollière & Mordasini 2012). The coupled formation and evolution calculations lead in population syntheses to planets with a range of post-formation entropies and deuterium abundances for more massive objects. This allows us to identify initial conditions for the evolution corresponding to the hottest, hot, warm, and cold post-formation states (Mordasini et al. 2017).
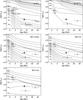 |
Fig. 4 HD 106906 b’s luminosity and age (filled circle) compared to evolutionary tracks. References and extracted mass estimates are listed in Table 4. The locations of other young, low-mass companions are shown for comparison (open symbols, target names in the first panel; Chauvin et al. 2017; Bowler 2016). |
Figure 4 shows HD 106906 b with respect to the evolutionary tracks. We adopt an age of 13 ± 2 Myr, assuming that there is no significant delay of the formation of HD 106906 b compared to other members of Upper Scorpius and its host star. To estimate the mass of HD 106906 b, we linearly interpolate each grid at the age and luminosity of HD 106906 b. Mass estimates, listed in Table 4, range from M = 12.5 ± 1.0 MJup to  MJup, depending on the initial entropy of the formation scenario, i.e., whether a hot star or cold start model was used, and on the atmospheric dust model. When assuming a 3 Myr formation timescale (cf. Fortney et al. 2005) for HD 106906 b (i.e., an effective age of 10 ± 2 Myr), the derived masses decrease by 0−0.7 MJup (see Table 4).
3.5. Upper limits on accretion
We do not detect any evidence for line emission, in particular not in the accretion-sensitive hydrogen features, i.e., Paschen-β (Paβ, 1.282 μm) and Brackett-γ (Brγ, 2.167 μm), or in the limit of the Brackett series (H band). Accordingly, we do not see evidence for strong accretion activity onto HD 106906 b. Assuming magnetospheric accretion from an isolated circumplanetary disk onto HD 106906 b, we infer a quantitative upper limit for the mass accretion rate based on the upper limit for the accretion luminosity Lacc and empirical Lacc−Lline relations derived for T Tauri stars (Alcalá et al. 2014).
We use the description by Gullbring et al. (1998) to estimate a mass accretion rate from an accretion luminosity using  (2)Following Lovelace et al. (2011), we conservatively set the inner disk truncation radius Rin = 2.7 Rpl. Larger radii, such as Rin = 5 Rpl, which are commonly used for T Tauri stars, result in stronger constraints on the inferred upper limit of the mass accretion rate of up to a factor of 1.5. The mass and radius of the companion were set to Mpl = 12.3 ± 0.8 MJup and Rpl = 1.6 RJup, which is consistent with our derived luminosity and temperature. Flux calibration of the spectra was achieved by normalizing the spectra, after multiplication with the spectral response curves of the respective filters, to the J and Ks magnitudes measured by Bailey et al. (2014)3. The measured continuum noise values in Paβ and Brγ of ΔFdλ(Paβ) = 1.4 × 10⁻¹⁸ erg/s/cm2 and ΔFdλ(Brγ) = 1.6 × 10⁻¹⁸ erg/s/cm2 translate to upper limits of the line luminosity Lline = 4πFlined2 of log (Lline/L⊙) < −8.78 and <−8.95, respectively (99% confidence). Using the Lacc−Lline correlations listed Alcalá et al. (2014) we infer log (Lacc/L⊙) < −5.63 (Paβ) and log (Lacc/L⊙) < −6.20 (Brγ). Using Eq. (2) we infer upper limits for the mass accretion rate of Ṁ < 1.8 × 10⁻⁹ MJup yr-1 (Paβ) and Ṁ < 4.8 × 10⁻¹⁰ MJup yr-1 (Brγ).
Masses from isochrone fits.
Uncertainties and upper limits were calculated using a Monte Carlo simulation taking into account the uncertainties in measured flux, mass, distance, and the empirical Lacc−Lline relations (Alcalá et al. 2014). We conservatively account for systematic uncertainties such as the flux calibration and the subtraction of hydrogen absorption in the telluric standard star spectra by increasing the spectral noise by a factor of 2. All quoted upper limits are 99% confidence limits. Since the mass accretion rate as calculated from Brγ results in the more restrictive limit, we quote Ṁ < 4.8 × 10⁻¹⁰ MJup yr-1 as our best estimate of the mass accretion rate for HD 106906 b.
We make a prediction for the expected accretion-induced line luminosity at the wavelength of Hα based on the derived line luminosity (using the more restrictive limit log (Lacc/L⊙) < −6.20 ). We use the Lacc−Lline relation from Alcalá et al. (2014) to derive log (LHα/L⊙) < −6.69 (99% confidence).
4. Summary and discussion
We present new high S/N (20–50/pixel) intermediate-resolution VLT/SINFONI 1−2.5 μm integral field spectroscopy of HD 106906 b, which is a companion at the deuterium burning limit in the Upper Scorpius association. We detect a number of spectral features indicative of a low mass for HD 106906 b, and also the H-band continuum shows the typical triangular shape of low gravity objects. Comparison with spectral libraries of young and field objects as well as analyzing spectral features suggests a spectral type of L1.5 ± 1.0. Previous estimates based on low-resolution spectroscopy classified this object as either L2 (based on H-band spectroscopy) or L3 (K-band spectroscopy; Bailey et al. 2014).
We use this new information and the recently published distance of HD 106906 b (Gaia Collaboration 2016, 102.8 ± 2.5 pc) to derive a luminosity of log (Lbol/L⊙) = −3.65 ± 0.08 and an effective temperature of Teff = 1820 ± 240 K; this recently published distance of this binary star is ~10% larger than the previous best estimate from the Hipparcos mission. Based on its luminosity and age compared to predictions from evolutionary models, we estimate a mass between M = 12.3 MJup (hot start) and M = 14.0
 MJup (cold start) in the limit of zero formation time. Mass predictions are slightly lower if a formation timescale of 3 Myr is assumed of between
  MJup and
  MJup.
MJup.
The formation and early evolution of HD 106906 b remain unclear. The low mass ratio of q ~ 0.004 with respect to the host system (MHD106906AB = 1.37 M⊙ + 1.34 M⊙; Lagrange et al. 2017) suggests “planet-like” formation in a protoplanetary disk (Pepe et al. 2014; Reggiani et al. 2016). Formation through core accretion, however, is restricted to orbits much closer to the star than its current separation of >700 AU (e.g., ≲35 AU in the simulations by Dodson-Robinson et al. 2009). Accordingly, subsequent migration would be required. Currently, however, no conclusive evidence for scattering with an internal planet or the central binary has been found (cf. Jílková & Portegies Zwart 2015). An ejection scenario with subsequent braking through a stellar fly-by appears unlikely in the light of the simulations by Rodet et al. (2017). While not strictly excluded, in situ formation through disk instability appears unlikely (though not excluded) because large disks >700 AU have been rarely observed around forming stars. Formation of HD 106906 b in a star-like channel, i.e., through direct collapse of the parent cloud core into a triple system HD 106906 AB+b, remains a possibility.
The degeneracy between the various formation scenarios could be broken when the orbit of HD 106906 b around its host system becomes known. Its long orbital period of >3000 yr (Jílková & Portegies Zwart 2015), however, precludes precise direct measurement of the motion of HD 106906 b. Indirect information on the orbit of HD 106906 b, however, may be gathered from observations of the circumstellar disk whose eccentricity is thought to reflect interaction with the companion (Nesvold et al. 2017). Alternatively, additional high precision spectroscopy in the atmospheric absorption bands (e.g., near 1.4 μm and 2 μm) and at mid-IR wavelengths together with retrieval analysis (e.g., Line et al. 2012) may be used to measure the chemical composition of the atmosphere of HD 106906 b, which is a function of its birth location. For example, an enhanced carbon-to-oxygen ratio suggests a formation in a disk close to the host star (e.g., Öberg et al. 2011). Direct collapse, in contrast, would produce a stellar abundance ratio. Future observation with high-precision spectroscopy instruments such as those on board the James Webb Space Telescope will help to break these degeneracies.
While the presented spectra cover a number of hydrogen features (Paschen-β, Brackett-γ, and higher), none of these features appears in emission. We thus exclude magnetospheric accretion onto HD 106906 b at a rate of Ṁ > 4.8 × 10⁻¹⁰ MJup yr-1 (99% confidence). With this measurement we can exclude accretion at a level several times below the accretion levels that have been observed for other targets at a similar mass and age as HD 106906 b. For example, Joergens et al. (2013) find a mass accretion rate of Ṁ = 8 × 10⁻⁹ MJup yr-1 for OTS 44, a free-floating 12 MJup member of the ~2 Myr-old Chamaeleon I region. DH Tau, an 11 MJup companion at ~340 AU from its ~1−2 Myr-old parent star, is thought to accrete at a rate of Ṁ = 3.3 × 10⁻⁹ MJup yr-1 (Zhou et al. 2014). For comparison with optical studies and as a reference for optical follow up, we predict an accretion-induced Hα line luminosity of log (LHα/L⊙) < −6.69. Previous observations of substellar companion candidates in Hα returned values of log (LHα/L⊙) = −4.2 (LkCa 15b; Sallum et al. 2015) and log (LHα/L⊙) = −3.3 (HD 142527B; Close et al. 2014), again significantly larger than our limit for HD 106906 b. If HD 106906 b were accreting, its rate must be significantly below that of these comparison objects. We thus conclude that HD 106906 b features no significant amount of circumplanetary gas. However, the present data do not exclude the presence of a gas-poor disk around HD 106906 b, similar to what has been observed for the primary object HD 106906 (Kalas et al. 2015; Lagrange et al. 2016). In fact, Kalas et al. (2015) present weak evidence for the presence of circumplanetary dust around HD 106906 b based on color excesses and a marginally spatially extended image of the source.
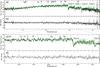 |
Fig. 5 Panel a: Teff = 1600 K, log g = 3.5 BT-SETTL model (green curve; Baraffe et al. 2015), smoothed to the resolution of our K-band spectrum HD 106906 b (black) and scaled to the same average flux. Most features observed in the spectra are reproduced by the (virtually noise-free) model, supporting evidence that the measured features are caused by atmospheric absorption rather than noise. Panel b: residuals. Panels c and d: same for a shorter wavelength range. |
Our new study makes HD 106906 b one of the few low-Teff companions for which high S/N spectroscopy could be observed. As demonstrated in Fig. 5, most of the observed features in the spectrum must be real rather than due to measurement uncertainties4. These high fidelity observations were possible with current instrumentation because of the large angular separation of HD 106906 b from its host star. Most other directly imaged systems feature much smaller separations, which reduce the achievable S/N due to additional light from the primary. The current spectrum thus serves as a reference spectrum for future studies of young low-gravity objects in orbit around low-mass stars, in particular with regard to the higher sensitivity of the James Webb Space Telescope and the higher angular resolution of the upcoming generation of 30 m-class telescopes.
The SINFONI image plane is filled with 32 × 64 rectangular pixels. To create the cube, every spatial pixel was automatically split by the pipeline into two neighboring square pixels with identical pixel values.
No H-band magnitudes have been published so far, so this technique could not be applied to our H-band spectrum.
We note that the selected model temperature is slightly below our best estimate of Teff = 1820 K. This selection was made due to a bimodal χ2 distribution of BT-SETTL model fits in log g–Teff space which has local minima at Teff≈ 1600 K and Teff~ 2600 K with a particularly poor representation of the K-band spectrum of HD 106906 b by Teff≈ 1700−2100 K models. Detailed model fitting to explore reasons for this bimodality is beyond the scope of the current paper.
Acknowledgments
We thank the anonymous referee for a thorough review and valuable suggestions for improvement. We thank Michael Line for valuable contributions in preparation of the observing time proposal. This work has been carried out within the frame of the National Centre for Competence in Research PlanetS supported by the Swiss National Science Foundation. S.D., S.P.Q., and G.-D.M. acknowledge the financial support of the SNSF. C.M. and G.-D.M. acknowledge the support from the Swiss National Science Foundation under grant BSSGI0_155816 “PlanetsInTime”. This work has made use of data from the European Space Agency (ESA) mission Gaia (http://www.cosmos.esa.int/gaia), processed by the Gaia Data Processing and Analysis Consortium (DPAC; http://www.cosmos.esa.int/web/gaia/dpac/consortium). Funding for the DPAC has been provided by national institutions, in particular the institutions participating in the Gaia Multilateral Agreement.
References
- Alcalá, J. M., Natta, A., Manara, C. F., et al. 2014, A&A, 561, A2 [NASA ADS] [CrossRef] [EDP Sciences] [Google Scholar]
- Allard, F., Hauschildt, P. H., Alexander, D. R., Tamanai, A., & Schweitzer, A. 2001, ApJ, 556, 357 [NASA ADS] [CrossRef] [Google Scholar]
- Allers, K. N., & Liu, M. C. 2013, ApJ, 772, 79 [NASA ADS] [CrossRef] [Google Scholar]
- Allers, K. N., Jaffe, D. T., Luhman, K. L., et al. 2007, ApJ, 657, 511 [NASA ADS] [CrossRef] [Google Scholar]
- Apai, D., Radigan, J., Buenzli, E., et al. 2013, ApJ, 768, 121 [NASA ADS] [CrossRef] [Google Scholar]
- Bailey, V., Meshkat, T., Reiter, M., et al. 2014, ApJ, 780, L4 [Google Scholar]
- Baraffe, I., Chabrier, G., Barman, T. S., Allard, F., & Hauschildt, P. H. 2003, A&A, 402, 701 [NASA ADS] [CrossRef] [EDP Sciences] [Google Scholar]
- Baraffe, I., Homeier, D., Allard, F., & Chabrier, G. 2015, A&A, 577, A42 [NASA ADS] [CrossRef] [EDP Sciences] [Google Scholar]
- Bonnefoy, M., Chauvin, G., Lagrange, A.-M., et al. 2014, A&A, 562, A127 [NASA ADS] [CrossRef] [EDP Sciences] [Google Scholar]
- Bowler, B. P. 2016, PASP, 128, 102001 [NASA ADS] [CrossRef] [Google Scholar]
- Bowler, B. P., Liu, M. C., Dupuy, T. J., & Cushing, M. C. 2010, ApJ, 723, 850 [NASA ADS] [CrossRef] [Google Scholar]
- Chabrier, G., Baraffe, I., Allard, F., & Hauschildt, P. 2000, ApJ, 542, 464 [NASA ADS] [CrossRef] [Google Scholar]
- Chauvin, G., Desidera, S., Lagrange, A.-M., et al. 2017, A&A, 605, L9 [Google Scholar]
- Chen, C. H., Jura, M., Gordon, K. D., & Blaylock, M. 2005, ApJ, 623, 493 [NASA ADS] [CrossRef] [Google Scholar]
- Close, L. M., Follette, K. B., Males, J. R., et al. 2014, ApJ, 781, L30 [NASA ADS] [CrossRef] [Google Scholar]
- Currie, T., Burrows, A., Itoh, Y., et al. 2011, ApJ, 729, 128 [NASA ADS] [CrossRef] [Google Scholar]
- Cushing, M. C., Rayner, J. T., & Vacca, W. D. 2005, ApJ, 623, 1115 [NASA ADS] [CrossRef] [Google Scholar]
- Cox, A. N. 2000, Allen’s Astrophysical Quantities, 4th edn. (New York: Springer) [Google Scholar]
- Daemgen, S., Correia, S., & Petr-Gotzens, M. G. 2012, A&A, 540, A46 [NASA ADS] [CrossRef] [EDP Sciences] [Google Scholar]
- Daemgen, S., Petr-Gotzens, M. G., Correia, S., et al. 2013, A&A, 554, A43 [NASA ADS] [CrossRef] [EDP Sciences] [Google Scholar]
- Dodson-Robinson, S. E., Veras, D., Ford, E. B., & Beichman, C. A. 2009, ApJ, 707, 79 [NASA ADS] [CrossRef] [Google Scholar]
- Faherty, J. K., Riedel, A. R., Cruz, K. L., et al. 2016, ApJS, 225, 10 [NASA ADS] [CrossRef] [Google Scholar]
- Filippazzo, J. C., Rice, E. L., Faherty, J., et al. 2015, ApJ, 810, 158 [NASA ADS] [CrossRef] [Google Scholar]
- Fortney, J. J., Marley, M. S., Hubickyj, O., Bodenheimer, P., & Lissauer, J. J. 2005, Astron. Nachr., 326, 925 [NASA ADS] [CrossRef] [Google Scholar]
- Gaia Collaboration (Brown, A. G. A., et al.) 2016, A&A, 595, A2 [NASA ADS] [CrossRef] [EDP Sciences] [Google Scholar]
- Golimowski, D. A., Leggett, S. K., Marley, M. S., et al. 2004, AJ, 127, 3516 [NASA ADS] [CrossRef] [Google Scholar]
- Gullbring, E., Hartmann, L., Briceño, C., & Calvet, N. 1998, ApJ, 492, 323 [NASA ADS] [CrossRef] [Google Scholar]
- Jílková, L., & Portegies Zwart, S. 2015, MNRAS, 451, 804 [NASA ADS] [CrossRef] [Google Scholar]
- Joergens, V., Bonnefoy, M., Liu, Y., et al. 2013, A&A, 558, L7 [NASA ADS] [CrossRef] [EDP Sciences] [Google Scholar]
- Kalas, P. G., Rajan, A., Wang, J. J., et al. 2015, ApJ, 814, 32 [NASA ADS] [CrossRef] [Google Scholar]
- Lagrange, A.-M., Langlois, M., Gratton, R., et al. 2016, A&A, 586, L8 [NASA ADS] [CrossRef] [EDP Sciences] [Google Scholar]
- Lagrange, A.-M., Mathias, P., Absil, O., et al. 2017, A&A, submitted [Google Scholar]
- Line, M. R., Zhang, X., Vasisht, G., et al. 2012, ApJ, 749, 93 [NASA ADS] [CrossRef] [Google Scholar]
- Lovelace, R. V. E., Covey, K. R., & Lloyd, J. P. 2011, AJ, 141, 51 [NASA ADS] [CrossRef] [Google Scholar]
- Madhusudhan, N., Burrows, A., & Currie, T. 2011, ApJ, 737, 34 [Google Scholar]
- Marley, M. S., Saumon, D., Cushing, M., et al. 2012, ApJ, 754, 135 [NASA ADS] [CrossRef] [Google Scholar]
- McLean, I. S., McGovern, M. R., Burgasser, A. J., et al. 2003, ApJ, 596, 561 [NASA ADS] [CrossRef] [MathSciNet] [Google Scholar]
- Meyer, M. R., Edwards, S., Hinkle, K. H., & Strom, S. E. 1998, ApJ, 508, 397 [NASA ADS] [CrossRef] [Google Scholar]
- Mollière, P., & Mordasini, C. 2012, A&A, 547, A105 [NASA ADS] [CrossRef] [EDP Sciences] [Google Scholar]
- Mordasini, C., Alibert, Y., Klahr, H., & Henning, T. 2012, A&A, 547, A111 [NASA ADS] [CrossRef] [EDP Sciences] [Google Scholar]
- Mordasini, C., Marleau, G.-D., Molliére, P. 2017, A&A, 608, A72 [NASA ADS] [CrossRef] [EDP Sciences] [Google Scholar]
- Nesvold, E. R., Naoz, S., & Fitzgerald, M. P. 2017, ApJ, 837, L6 [NASA ADS] [CrossRef] [Google Scholar]
- Öberg, K. I., Murray-Clay, R., & Bergin, E. A. 2011, ApJ, 743, L16 [NASA ADS] [CrossRef] [Google Scholar]
- Parker, R. J., & Quanz, S. P. 2012, MNRAS, 419, 2448 [NASA ADS] [CrossRef] [Google Scholar]
- Pecaut, M. J., Mamajek, E. E., & Bubar, E. J. 2012, ApJ, 746, 154 [NASA ADS] [CrossRef] [Google Scholar]
- Pepe, F., Ehrenreich, D., & Meyer, M. R. 2014, Nature, 513, 358 [NASA ADS] [CrossRef] [Google Scholar]
- Reggiani, M., Meyer, M. R., Chauvin, G., et al. 2016, A&A, 586, A147 [NASA ADS] [CrossRef] [EDP Sciences] [Google Scholar]
- Rodet, L., Beust, H., Bonnefoy, M., et al. 2017, A&A, 602, A12 [NASA ADS] [CrossRef] [EDP Sciences] [Google Scholar]
- Sallum, S., Follette, K. B., Eisner, J. A., et al. 2015, Nature, 527, 342 [NASA ADS] [CrossRef] [Google Scholar]
- Slesnick, C. L., Hillenbrand, L. A., & Carpenter, J. M. 2004, ApJ, 610, 1045 [NASA ADS] [CrossRef] [Google Scholar]
- Skemer, A. J., Hinz, P. M., Esposito, S., et al. 2012, ApJ, 753, 14 [NASA ADS] [CrossRef] [Google Scholar]
- Williams, J. P., & Cieza, L. A. 2011, ARA&A, 49, 67 [NASA ADS] [CrossRef] [Google Scholar]
- Wu, Y.-L., Close, L. M., Bailey, V. P., et al. 2016, ApJ, 823, 24 [NASA ADS] [CrossRef] [Google Scholar]
- Zhou, Y., Herczeg, G. J., Kraus, A. L., Metchev, S., & Cruz, K. L. 2014, ApJ, 783, L17 [NASA ADS] [CrossRef] [Google Scholar]
All Tables
All Figures
|
Fig. 1 Examples of individual, fully reduced, and sky-subtracted data cubes of HD 106906 b in J, H, and K band, median-collapsed in spectral direction. The bright region in the bottom right is created by the primary star just outside the field of view. Dark patches are visible where the sky image contains stars. An example aperture for the extraction of the spectra (r = 0.̋26) is superimposed on HD 106906 b on the K-band image in red. Panels show the full field of view of SINFONI (8 × 8′′); centering is subject to jitter offset. The color stretch is linear, the orientation of all panels as indicated in the Ks image. |
| In the text | |
|
Fig. 2 Fully reduced and averaged spectra in J (top), H (middle), and Ks band (bottom) binned by a factor of 2. Green spectra show individual observing periods (most recent on top); black are averaged from all individual exposures per filter. Each spectrum has been normalized individually; offsets and flux scales are arbitrary. Regions highlighted in magenta may contain residual noise from the removal of absorption lines (mostly hydrogen) in the telluric standard. The wavelengths of some atomic and molecular absorption features of low-mass stellar objects are highlighted (Cushing et al. 2005). Regions of strong telluric absorption potentially causing residuals in the reduction are indicated by the black horizontal bars. |
| In the text | |
|
Fig. 3 Comparison of our spectra (black) with the libraries of young star spectra (red) by Allers & Liu (2013, and Bonnefoy et al. (2014, . The J, H, and K spectra have been normalized and matched for each band individually. |
| In the text | |
|
Fig. 4 HD 106906 b’s luminosity and age (filled circle) compared to evolutionary tracks. References and extracted mass estimates are listed in Table 4. The locations of other young, low-mass companions are shown for comparison (open symbols, target names in the first panel; Chauvin et al. 2017; Bowler 2016). |
| In the text | |
|
Fig. 5 Panel a: Teff = 1600 K, log g = 3.5 BT-SETTL model (green curve; Baraffe et al. 2015), smoothed to the resolution of our K-band spectrum HD 106906 b (black) and scaled to the same average flux. Most features observed in the spectra are reproduced by the (virtually noise-free) model, supporting evidence that the measured features are caused by atmospheric absorption rather than noise. Panel b: residuals. Panels c and d: same for a shorter wavelength range. |
| In the text | |
Current usage metrics show cumulative count of Article Views (full-text article views including HTML views, PDF and ePub downloads, according to the available data) and Abstracts Views on Vision4Press platform.
Data correspond to usage on the plateform after 2015. The current usage metrics is available 48-96 hours after online publication and is updated daily on week days.
Initial download of the metrics may take a while.