Fig. 5
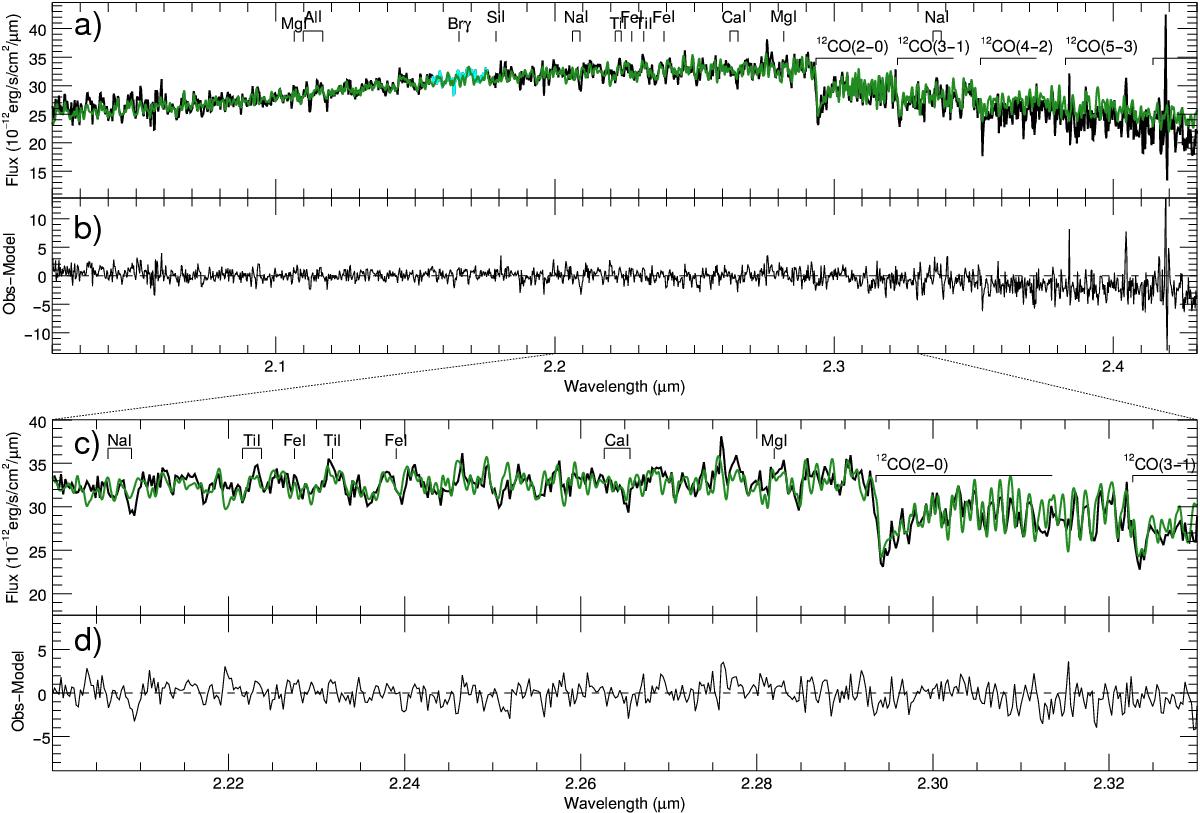
Panel a: Teff = 1600 K, log g = 3.5 BT-SETTL model (green curve; Baraffe et al. 2015), smoothed to the resolution of our K-band spectrum HD 106906 b (black) and scaled to the same average flux. Most features observed in the spectra are reproduced by the (virtually noise-free) model, supporting evidence that the measured features are caused by atmospheric absorption rather than noise. Panel b: residuals. Panels c and d: same for a shorter wavelength range.
Current usage metrics show cumulative count of Article Views (full-text article views including HTML views, PDF and ePub downloads, according to the available data) and Abstracts Views on Vision4Press platform.
Data correspond to usage on the plateform after 2015. The current usage metrics is available 48-96 hours after online publication and is updated daily on week days.
Initial download of the metrics may take a while.