Fig. 4
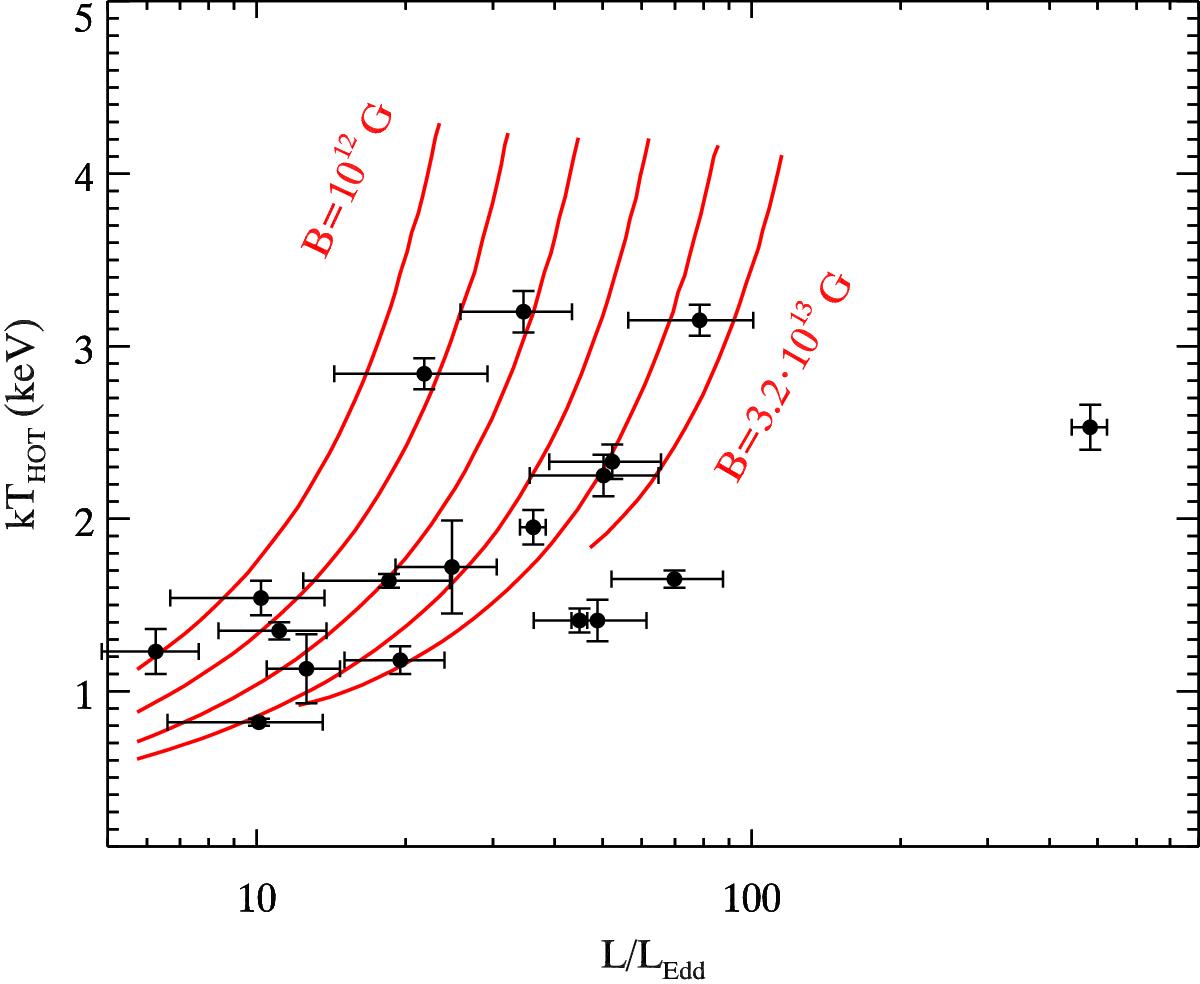
Unabsorbed luminosity (in the 0.5–10 keV range) vs. the temperature (in keV) of the hot multicolour disk component for the XMM-Newton data (Table 2). The (red) solid curves correspond to internal temperature (Tin) of the accretion curtain versus total luminosity, as predicted by Mushtukov et al. (2017; see their Fig. 3). Different curves correspond to different magnetic field strength. From left to right it is 1012, 2 × 10¹², 4 × 10¹², 8 × 10¹², 1.6 × 10¹³ and 3.2 × 10¹³ G.
Current usage metrics show cumulative count of Article Views (full-text article views including HTML views, PDF and ePub downloads, according to the available data) and Abstracts Views on Vision4Press platform.
Data correspond to usage on the plateform after 2015. The current usage metrics is available 48-96 hours after online publication and is updated daily on week days.
Initial download of the metrics may take a while.