| Issue |
A&A
Volume 608, December 2017
|
|
|---|---|---|
| Article Number | A80 | |
| Number of page(s) | 6 | |
| Section | Interstellar and circumstellar matter | |
| DOI | https://doi.org/10.1051/0004-6361/201629365 | |
| Published online | 08 December 2017 | |
OH masers towards IRAS 19092+0841
1 Jodrell Bank Centre for Astrophysics, School of Physics and Astronomy, Alan Turing Building University of Manchester, Manchester, M13 9PL, UK
2 Al-Azhar University, Faculty of Science, Astronomy Department, PO Box 11884 Naser City, Cairo, Egypt
e-mail: This email address is being protected from spambots. You need JavaScript enabled to view it.
3 Hamburger Sternwarte, Gojenbergsweg 112, 21029 Hamburg, Germany
Received: 21 July 2016
Accepted: 26 July 2017
Abstract
Context. Maser emission is a strong tool for studying high-mass star-forming regions and their evolutionary stages. OH masers in particular can trace the circumstellar material around protostars and determine their magnetic field strengths at milliarcsecond resolution.
Aims. We seek to image OH maser emission towards high-mass protostellar objects to determine their evolutionary stages and to locate the detected maser emission in the process of high-mass star formation.
Methods. In 2007, we surveyed OH maser emission towards 217 high-mass protostellar objects to study its presence. In this paper, we present follow-up MERLIN observations of a ground-state OH maser emission towards one of these objects, IRAS 19092+0841.
Results. We detect emissions from the two OH main spectral lines, 1665 and 1667 MHz, close to the central object. We determine the positions and velocities of the OH maser features. The masers are distributed over a region of ~ 5′′ corresponding to 22 400 AU (or ~0.1 pc) at a distance of 4.48 kpc. The polarization properties of the OH maser features are determined as well. We identify three Zeeman pairs from which we inferred a magnetic field strength of ~4.4 mG pointing towards the observer.
Conclusions. The relatively small velocity spread and relatively wide spacial distribution of the OH maser features support the suggestion that this object could be in an early evolutionary state before the presence of disk, jets or outflows.
Key words: masers / molecular data / stars: formation / stars: protostars / ISM: individual objects: IRAS 19092+0841 / polarization
© ESO, 2017
1. Introduction
Observations show that OH masers are associated with different evolutionary stages of star-forming regions. It was believed that they are only associated with HII regions (e.g. Garay & Lizano 1999). However, observations that have been carried out towards a number of star-forming regions show that OH masers are also associated with an earlier stage before the appearance of ionized HII regions (e.g. Cohen et al. 1988; Braz et al. 1990). This later type of OH maser is associated with an accretion phase, outflow, and circumstellar disks (Brebner et al. 1987; Hutawarakorn & Cohen 1999; Hutawarakorn et al. 2002; Fuller et al. 2001; Edris et al. 2005). An OH maser survey by Edris et al. (2007, hereafter EFC07) detected the OH masers towards 26% of a sample of 217 high-mass protostellar objects (HMPOs) candidates. It is of interest to know the distributions of the OH masers and their associations towards these regions in addition to their position in the evolutionary sequence. Maser emission gives a unique opportunity of observing those typically far regions in some detail. This paper is the second follow up of the EFC07 survey with a high angular resolution observation. One of EFC07 objects (IRAS 20126+4104; hereafter IRAS 20126) was studied by Edris et al. (2005) in the ground-state OH, 22-GHz H2O, and 6.7-GHz class II CH3OH masers lines.
The present object of study, IRAS 19092+0841 (hereafter IRAS 19092), is one of the HMPOs sample studied by Palla et al. (1991) and Molinari et al. (1996, 1998, 2000). Palla et al. (1991) divided this sample of 260 IRAS sources into two subsamples of so-called high and low sources. The high sources are the sources located in the “higher” part of the colour-colour diagram such that [25−12] > = 0.57, which in essence is the prescription for the presence of associated ultra-compact HII (UCHII) regions according to Wood & Churchwell (1989) criteria. On the other hand, the low sources are most probably made of two groups of sources with a distinct evolutionary state (Molinari et al. 1996). The first low group of sources is believed to be at a very early evolutionary state before the creation of a real young stellar object at the centre and consequently before the appearance of any detectable UCHII regions. The other low group of sources is believed to contain more evolved sources (older than the high sources) containing objects that have already dispersed much of their circumstellar material. IRAS 19092 belongs to the latter group of the low subsample. IRAS 19092 is at an estimated distance of 4.48 kpc (Molinari et al. 1996) and has a luminosity of 104L⊙. An ammonia core was found towards IRAS 19092 at velocity ~58 km s-1 (Molinari et al. 1996).
IRAS 19092 is associated with different types of maser emission. OH maser was originally reported by MacLeod et al. (1998) and then by EFC07. Water maser was detected by Palla et al. (1991). IRAS 19092 is also associated with the class I methanol masers emission at 44 GHz, but it is not associated with maser emission at 95 GHz (Kurtz et al. 2004; Fontani et al. 2010). Class II CH3OH masers at 6.7 GHz were detected by Szymczak et al. (2000) and mapped by Pandian et al. (2011). CO and H2 observations failed to detect any sign of outflows in this region (Zhang et al. 2005; Varricatt et al. 2010). IRAS 19092 is not associated with a close cm radio continuum emission. The closest cm continuum emission detected by Molinari et al. (1998) at 6 cm is offset from the IRAS position by 110 arcsec. However, IRAS 19092 is associated with mm continuum emission detected by Molinari et al. (2000) and the Bolocam Galactic Plane Survey (BGPS; Rosolowsky et al. 2010).
To determine what the OH masers trace and how they are distributed and related to other tracers, IRAS 19092 has been observed at high angular resolution using MERLIN. The details of the observations and reduction are given in Sect. 2 and the results are presented in Sect. 3. In Sect. 4 we discuss the interpretation while conclusions are drawn in Sect. 5.
Observing and calibration parameters for the MERLIN spectral-line observations of IRAS 19092.
2. Observations and data reduction
Table 1 gives the parameters for the MERLIN observations. The phase calibrator source 1919+086 was used to retrieve the absolute position of the maser components and therefore compare their locations from one line to another. A bandpass calibrator 3C 84 was observed to calibrate the variation of instrumental gain and phase across the spectral bandpass. Observations of 3C 286 were also made during the observing run, with the same correlator configuration and bandwidth, to calibrate for the polarization angle.
IRAS 19092 was observed in the 1665- and 1667-MHz OH maser transitions in April 2003 using the seven telescopes of the MERLIN network available at that time. During the observations, the frequency was cycled between the two OH line frequencies to provide data on both transitions spread over the whole observing track. The velocity resolution was 0.21 km s-1 for a total of 0.25 MHz spectrum bandwidth corresponding to a 45 km s-1 velocity range. The observations were performed in full polarization mode. The removal of obvious bad data and correction for gain-elevation effects were performed using the MERLIN d-programs (see Diamond et al. 2003). The flux density of the amplitude calibrator 3C 84 was determined by comparing the visibility amplitudes on the shortest baselines with those of 3C 286. Using flux density of 13.625 Jy for 3C 286 (Baars et al. 1977), the flux density of 3C 84 at the time of the observation was determined to be 21 Jy.
In AIPS more refined editing was performed and the data were calibrated for all remaining instrumental and atmospheric effects. Starting from a point source model, the phase calibrator was mapped with a total of three rounds of phase self-calibration and the resulting corrections were applied to the source data. The polarization leakage for each antenna was determined using 3C 84 and the polarization position angle correction was performed using 3C 286. Maps of the LHC and RHC emission were produced, and finally the maps of the Stokes parameters (I, Q, U, and V) were produced using clean algorithms in AIPS. The rms noise, after CLEANing, was typically 14 mJy/beam and the FWHM of the restoring beam is 0.9 × 0.4 arcsec at a position angle of − 31°.
The individual channel maps usually showed one, two, or three unresolved components, and each component was usually seen across several spectral channels. The positions of the maser components were determined by fitting two-dimensional Gaussian components to the brightest peaks in each channel map. Components were considered as spectral features if they occurred in three or more consecutive channels and were then grouped into spectral features. The positions and velocities of these maser features were obtained by taking flux weighted means over those channels showing emission from the feature. The uncertainties in relative positions are given in Table 2, while the absolute positional accuracy is estimated as described in Edris et al. (2005) to be better than 30 mas. This positional uncertainty depends on four factors: the position accuracy of the phase calibrator, accuracy of the telescope positions, relative position error depending on the beam size and signal-to-noise ratio and, finally, atmospheric variability.
Parameters of the left- and right-hand circular polarization features of 1665-MHz and the 1667-MHz OH masers detected towards IRAS 19092.
Stokes and polarization parameters of the 1665- and 1667-MHz OH masers features detected towards IRAS 19092.
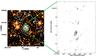 |
Fig. 1 Left panel: image for the IRAS 19092 region at the Ks band at 2.17 μm with superimposed SCUBA 850 μm continuum in white contours (from Faustini et al. 2009; Fig. A.16). The small box in the middle represent the area of 1665-MHz OH maser maps shown in the right panel. The OH masers peak flux is 7.24 Jy beam-1 and the contour levels are 0.12 × (4, 8, 16, 32, 60, 120). |
3. Results
The 1665- and 1667-MHz OH maser lines were detected with MERLIN. The absolute position of the brightest maser feature in the 1665 MHz OH line is 19h11m38.974s+ 08°46′31.09′′ at velocity 58 km s-1. Radial velocities, here and elsewhere, are given relative to the local standard of rest (LSR).
A total of 11 (9 in the 1665-MHz line and 2 in the 1667-MHz line) OH maser features were detected. At the 1665-MHz line, there are 5 left-hand circular polarization (LHC) and 4 right-hand circular polarization (RHC) features while the two features detected at the 1667-MHz line are LHC. Table 2 presents the parameters of the OH maser features detected, namely the velocities, peak intensities, and positions for each hand of circular polarization. The label Z identifies the left-hand and right-hand polarized features of a Zeeman pair. These Zeeman pairs were identified by searching Tables 2 and 3 for groups of features of opposite polarization that coincide to within the positional uncertainties. Three possible Zeeman pairs were identified, which indicates that the 1665 MHz OH line in IRAS 19092 experience zeeman splitting of several km s-1 exceeding the line width (less than 1 km s-1). The strength of the magnetic field can be measured from the velocity difference between the two hands of polarization (Elitzur 1996). The splitting of + 2.49 to + 2.67 km s-1 between the left- and right-hand polarized features of the 3 Zeeman pairs Z1−Z3 (cf. Table 2) leads to a magnetic field strengths ranging from 4.2 to 4.6 mG pointing towards us. The magnetic field measured towards IRAS 19092 is very similar to what was measured towards other star-forming regions such as W3(OH) (Garcia-Barreto et al. 1988), W75N (Hutawarakorn et al. 2002) and W51 (Etoka et al. 2012) harboring massive central objects at early stages of the star-forming process.
Figure 1 shows the map of the OH maser compared to the 1.1 mm map from Faustini et al. (2009). The OH maser are spread over a region of ~ 5′′ (or 17′′ if the far northern 1665 MHz feature 5 is included) corresponding to 22 400 AU (or ~0.1 pc) at a distance of 4.48 kpc. The two features of the 1667-MHz line (Table 2) are closely associated (≤ 300 mas) with the lowest declination components at 1667 MHz of relatively weak intensity.
Table 3 presents the Stokes parameters I, Q, U, and V, the polarization position angle χ (angles are measured from north towards east), the linearly polarized flux P, the percentage of linear polarization mL, the percentage of circular polarization mC, and the total percentage of polarization mT of each feature. The Stokes intensities are shown as zero in this table if their flux is below the noise level. There are only two features that are not polarized.
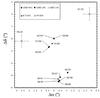 |
Fig. 2 Positions of the MERLIN 1.6-GHz OH maser features, VLA 44 GHz class I methanol maser features from Kurtz et al. (2004), and MERLIN 6.7 GHz class II methanol masers (Pandian et al. 2011). The symbol that refers to each tracer is shown in the upper left corner of the plot. The plot shows close association between the OH masers and some 6.7-GHz Methanol maser features. The absolute positional accuracies of the MERLIN 1.6-GHz and 6.7-GHz masers are 30 mas (see Sect. 2) and 15 mas, respectively, which is smaller than the size of the symbols. The VLA absolute positional accuracies in RA and Dec associated with the 44 GHz methanol masers are shown by the horizontal and vertical bars, respectively. The origin is at RA (J2000) =19h11m38.974s, Dec (J2000) =+ 08°46′31.09′′. The velocities of the maser features are given. For convenience, the fifth feature of the LHC (~ 14′′ offset) and a far north feature of the 44-GHz (~ 7′′ offset) were not included in this figure. |
4. Discussion
The observations reported towards the IRAS 19092 region suggest that it is a star-forming region in an early evolutionary state before the formation of HII region. It is not associated with neither cm continuum emission nor outflow signature (Molinari et al. 1998; Zhang et al. 2005; Varricatt et al. 2010). The velocity spread and distribution of the OH maser emission of the observations presented here may indicate that collapsing processes are dominant. The velocity extent is less than 3 km s-1 for an overall maser emission extent of 22 400 AU. Wu et al. (2007) reported a close ~ 10′′ south-west source with some spectral lines showing a blue profile expected to be the signature of an inflow motion. The weak flux density of the detected OH masers suggests that IRAS 19092 is in an early evolutionary state. The survey of EFC07 for OH masers towards high-mass protostellar objects found that most of the detected sources show OH flux densities <4.5 Jy, while the OH masers associated with HII regions show much higher flux densities (e.g. Gaume, & Mutel 1987; Gasiprong et al. 2002). Fontani et al. (2006) reported the lack of deuterium towards this region and concluded that IRAS 19092+0841 is associated with a cold and dense gas with chemical and physical conditions identical to those associated with low-mass starless cores. The presence of class I methanol masers (Kurtz et al. 2004) supports the suggestion of early evolutionary state. Ellingsen (2006) suggested that the class I methanol masers may signify an earlier stage of high-mass star formation than the class II masers. The early evolutionary stage interpretation is also consistent with the suggestion of Molinari et al. (1996) that some of the sources in the low sample (to which IRAS 19092 is related; see Sect. 1) are in an earlier evolutionary state than their counterparts in the high sample.
4.1. Comparison with other tracers
The OH masers were previously detected by Macleod et al. (1998) and EFC07. There is no remarkable change between the three observations in the spectrum, velocity range, or peak velocity, but the flux density in the later survey of EFC07 was relatively stronger (3.45 Jy). Also in the survey of EFC07 the 1665 MHz (at LHC) spectrum showed a weak feature at velocity 55 km s-1 that did not appear in the spectrum of Macleod et al. (1998) or in the present observations. This feature at 55 km s-1 has the same velocity as the class II methanol maser at 6.7 GHz detected by Szymczak et al. (2000) and more recently by Fontani et al. (2010). In the 6.7 GHz spectrum of Fontani et al. (2010) and Pandian et al. (2011), a new weaker methanol maser feature appears at velocity ≃63 km s-1 (their Figs. A.2 and 1).
The velocities of the OH maser features are more consistent with those of the 44 GHz class I than those of the 6.7 GHz class II methanol masers. On the other hand, the 6.7 GHz class II methanol maser component (centred at V ~ 55 km s-1) do not coincide with any OH maser spectral features. The close association of OH (in particular the 1665 MHz line) and class II methanol masers have been proposed by Caswell (1996) from subarcsec accuracy survey and modelled by Cragg et al. (2002). In some cases a disk has been suggested to be the source of the two maser types (Edris et al. 2005; Gray et al. 2003). However, a close association between OH masers and class I methanol masers towards sources in such early evolutionary state has never been reported so far. The flux ratio of these masers, S(6668)/S(1665) = 6/1.5 = 4 and S(44) /S(1.6) = 1/1.5 = 0.6, places IRAS 19092 in OH-favoured sources. Although the OH and class I CH3OH masers are associated, there is a clear difference in position, amounting to 2.7 arcsec (~0.06 pc), suggesting that the OH and class I CH3OH masers are not co-propagating. The water masers associated with IRAS 19092 (Palla et al. 1991; Brand et al. 1994) peak at velocity ≃57 km s-1 with a velocity range of 2.5 km s-1. This may indicate a more compact region than that of the OH masers.
The velocity of the strongest OH maser feature agrees with the gas velocity of the ammonia core measured by Molinari et al. (1996) and the peak velocity of the C34S observations (which is assumed to represent the velocity of high-density gas) carried out by Brand et al. (2001). This indicates that the OH masers emission originated from the core of this region, which is also consistent with the submm map of Faustini et al. (2009; Fig. 1).
The OH masers seem to arise from the core of the 850 μm continuum emission. However, the relatively small velocity spread of the OH maser features despite their relatively large distributions of 5′′ (or 17′′ if the far northern feature [1665-MHz F5] is included) indicates that the maser emission arises from material that is not close to the central object. The relatively small velocity spread may also refer to weak angular momentum and collapsing. This also indicates that the OH maser emission arises from material that is not very close to the central object. This is consistent with the relatively weak excitation temperature of 10 K (Fontani et al. 2006) compared to the gas kinetic temperature of 40 K (Brand et al. 2001). Measuring the deuterium fractionation and the CO depletion factor of IRAS 19092 among ten high-mass protostellar candidates, Fontani et al. (2006) proposed two scenarios for the location of emitting gas. In the first scenario, the cold gas is distributed in an external shell that is not yet heated up by the high-mass protostellar object, which is a remnant of the parental massive starless core. In the second scenario, the cold gas is located in cold and dense cores close to the high-mass protostar but not associated with it. The observations presented here support the first scenario mentioned. This is also consistent with the association of the OH masers with the class I methanol masers at 44-GHz detected by Kurtz et al. (2004). If the second scenario is true then the driving source needs still to be identified. Potential candidates are the two faint near-IR sources (2MASS K-Band survey) and the 1.1 mm sources (BGPS Survey; Fig. 2). Unfortunately, the poor positional uncertainty of these tracers does not allow us to draw any conclusion.
It is unclear whether the water and class II methanol masers at 6.7 MHz are associated with another source or associated with the driving source. The peak velocities and velocity ranges of these other maser types are slightly different from those of 1.6-GHz OH masers. The water maser emission peak is centred at V = 57.32 km s-1 according to Palla et al. (1991) single-dish observations, while the 6.7 GHz methanol maser emission peak is centred at V = 55 km s-1 (Pandian et al. 2011). High angular resolution observations of the water maser emission are needed to compare its location with respect to the other maser species in the region and infer what it traces.
4.2. Comparison with IRAS 20126
IRAS 20126 has been mapped at same high angular resolutions by Edris et al. (2005) in the ground-state lines of OH masers and in the 22-GHz H2O and 6.7-GHz (class II) CH3OH masers. Comparing the velocity range of the OH masers of IRAS 19092 with that of IRAS 20126, it is clear that towards the latter the velocity range (~17 km s-1) is spread much more than that of the former (~3 km s-1) although the spatial distributions of the maser features work oppositely. The OH maser features of IRAS 19092 trace an area of angular size three times that of IRAS 20126. The OH masers in IRAS 20126 trace a circumstellar disk while there is no signature of a circumstellar disk towards IRAS 19092. The strength of the magnetic field measured by a Zeeman pair in IRAS 20126 is approximately three times stronger than that of IRAS 19092. This is also consistent with the classification of Molinari et al. (1996). They classify IRAS 19092 as a source from the low sample while IRAS 20126 belongs to the high sample.
The association of OH masers and the two classes of methanol masers are common between these two sources. Towards IRAS 20126, the class I 44 GHz methanol masers imaged at arcsec resolution using the VLA by Kurtz et al. (2004) are ~7 arcsec (≃0.05 pc) away from the OH maser position, while the class II 6.7 GHz methanol masers are just ≃0.1 arcsec (≃0.001 pc or 170 AU) away. Towards IRAS 19092, the closest feature of the class I 44 GHz methanol masers by Kurtz et al. (2004) is ≃0.2 arcsec (0.004 pc) away from the OH masers, while the class II 6.7 GHz methanol masers are ≃0.4 arcsec (≃0.009 pc) away.
Towards IRAS 20126, the flux density of the OH masers is stronger than that of IRAS 19092. Only the 1665 MHz OH line has been detected towards IRAS 20126 while the 1665 and 1667 MHz lines have been detected towards IRAS 19092. The presence of the two OH mainlines towards IRAS 19092 indicates lower gas temperatures and lower density according to the models of Cragg et al. (2002) and Gray et al. (1991). All this indicates that IRAS 19092 is in an earlier evolutionary stage than IRAS 20126.
5. Conclusions
Ground-state OH maser emission at 1665 and 1667 MHz was observed towards IRAS 19092 at high angular resolution using MERLIN. Most of the OH maser features are spread over a region of ~ 5′′ corresponding to 22400 AU (or ~0.1 pc) at a distance 4.48 kpc. We identify three Zeeman pair, indicating a magnetic field strength ranging from ~ 4.2 to ~ 4.6 mG. The absence of any sign of disk, outflow, or HII region and the presence of 44-GHz class I methanol masers suggest that this source is in a very early evolutionary stage of star formation. High angular resolution observations of other tracers in the region are needed to study this SFR in more depth.
Acknowledgments
MERLIN is a national facility operated by the University of Manchester at Jodrell Bank Observatory on behalf of PPARC.
References
- Baars, J. W. M., Genzel, R., Pauliny-Toth, I. I. K., & Witzel, A. 1977, A&A, 61, 99 [NASA ADS] [Google Scholar]
- Brand, J., Cesaroni, R., Caselli, P., et al. 1994, A&AS, 103, 541 [NASA ADS] [Google Scholar]
- Brand, J., Cesaroni, R., Palla, F., & Molinari, S. 2001, A&A 370, 230 [Google Scholar]
- Braz, M. A., Lepine, L. R. D., Sivagnanam, P., & Le Squeren, A. M. 1990, A&A, 236, 479 [NASA ADS] [Google Scholar]
- Brebner, G. C., Heaton, B., Cohen, R. J., & Davies, S. R. 1987, MNRAS, 229, 679 [NASA ADS] [CrossRef] [Google Scholar]
- Caswell, J. L. 1996, MNRAS, 279, 79 [NASA ADS] [CrossRef] [Google Scholar]
- Cohen, R. J., Baart, E. E., & Jonas, J. L. 1988, MNRAS, 231, 205 [NASA ADS] [CrossRef] [Google Scholar]
- Cragg, D. M., Sobolev, A. M., & Godfrey, P. D. 2002, MNRAS, 331, 521 [NASA ADS] [CrossRef] [Google Scholar]
- Diamond, P. J., Garrington, S. T., Gunn, A. G., et al. 2003, MERLIN User Guide, ver. 3 [Google Scholar]
- Edris, K. A., Fuller, G. A., Cohen, R. J., & Etoka, S. 2005, A&A, 343, 213 [NASA ADS] [CrossRef] [EDP Sciences] [Google Scholar]
- Edris, K. A., Fuller, G. A., & Cohen, R. J. 2007, A&A, 465, 865 (EFC07) [NASA ADS] [CrossRef] [EDP Sciences] [Google Scholar]
- Ellingsen, S. P. 2006, ApJ, 638, 241 [NASA ADS] [CrossRef] [Google Scholar]
- Elitzur, M. 1996, ApJ, 457, 415 [NASA ADS] [CrossRef] [Google Scholar]
- Etoka, S., Gray, M. D., & Fuller, G. A. 2012, MNRAS, 423, 647 [NASA ADS] [CrossRef] [Google Scholar]
- Faustini, F., Molinari, S., Testi, L., & Brand, J. 2009, A&A, 503, 801 [NASA ADS] [CrossRef] [EDP Sciences] [Google Scholar]
- Fontani, F., Caselli, P., Crapsi, A., et al. 2006, A&A, 460, 709 [NASA ADS] [CrossRef] [EDP Sciences] [Google Scholar]
- Fontani, F., Cesaroni, R., & Furuya, R. S. 2010, A&A, 517, A56 [NASA ADS] [CrossRef] [EDP Sciences] [Google Scholar]
- Fuller, G. A., Zijlstra, A. A., & Williams, S. J. 2001, ApJ, 555, L125 [NASA ADS] [CrossRef] [Google Scholar]
- Garay, G., & Lizano, S. 1999, PASP, 111, 1049 [NASA ADS] [CrossRef] [Google Scholar]
- Garcia-Barreto, J. A., Burke, B. F., Reid, M. J., et al. 1988, ApJ, 326, 954 [NASA ADS] [CrossRef] [Google Scholar]
- Gasiprong, N., Cohen, R. J., & Hutawarakorn, B. 2002, MNRAS, 336, 47 [NASA ADS] [CrossRef] [Google Scholar]
- Gaume, R. A., & Mutel, R. L. 1987, ApJS, 65, 193 [NASA ADS] [CrossRef] [Google Scholar]
- Gray, M. D., Doel, R. C., & Field, D. 1991, MNRAS, 252, 30 [NASA ADS] [CrossRef] [Google Scholar]
- Gray, M. D., Hutawarakorn, B., & Cohen, R. J. 2003, MNRAS, 343, 1067 [NASA ADS] [CrossRef] [Google Scholar]
- Hutawarakorn, B., & Cohen, R. J. 1999, MNRAS, 303, 845 [NASA ADS] [CrossRef] [Google Scholar]
- Hutawarakorn, B., Cohen, R. J., & Brebner, G. C. 2002, MNRAS, 330, 349 [NASA ADS] [CrossRef] [Google Scholar]
- Kurtz, S., Hofner, P., & Alvarez, C. V. 2004, ApJS, 155, 149 [NASA ADS] [CrossRef] [Google Scholar]
- MacLeod, G., van der Walt, D. J., North, A., et al. 1998, AJ, 116, 2936 [NASA ADS] [CrossRef] [Google Scholar]
- Molinari, S., Brand, J., Cesaroni, R., & Palla, F. 1996, A&A, 308, 573 [NASA ADS] [Google Scholar]
- Molinari, S., Brand, J., Cesaroni, R., et al. 1998, A&A, 336, 339 [NASA ADS] [Google Scholar]
- Molinari, S., Brand, J., Cesaroni, R., & Palla, F. 2000, A&A, 355, 617 [NASA ADS] [Google Scholar]
- Palla, F., Brand, J., Cesaroni, R., et al. 1991, A&A, 246, 249 [NASA ADS] [Google Scholar]
- Pandian, J. D., Momjian, E., Xu, Y., Menten, K. M., & Goldsmith, P. F. 2011, ApJ, 730, 55 [NASA ADS] [CrossRef] [Google Scholar]
- Rosolowsky, E., Dunham, M. K., Ginsburg, A., et al. 2010, ApJS, 188, 123 [NASA ADS] [CrossRef] [Google Scholar]
- Szymczak, M., Hrynek, G., & Kus, A. J. 2000, A&AS, 143, 269 [NASA ADS] [CrossRef] [EDP Sciences] [Google Scholar]
- Varricatt, W. P., Davis, C. J., Ramsay, S., & Todd, S. P. 2010, MNRAS, 404, 661 [NASA ADS] [CrossRef] [Google Scholar]
- Wood, D. O. S., & Churchwell, E. 1989, ApJS, 83, 119 [Google Scholar]
- Wu, Y., Henkel, C., Xue, R., Guan, X., & Miller, M. 2007, ApJ, 669, 37 [Google Scholar]
- Zhang, Q., Hunter, T. R., Brand, J., et al. 2005, ApJ, 625, 864 [NASA ADS] [CrossRef] [Google Scholar]
All Tables
Observing and calibration parameters for the MERLIN spectral-line observations of IRAS 19092.
Parameters of the left- and right-hand circular polarization features of 1665-MHz and the 1667-MHz OH masers detected towards IRAS 19092.
Stokes and polarization parameters of the 1665- and 1667-MHz OH masers features detected towards IRAS 19092.
All Figures
|
Fig. 1 Left panel: image for the IRAS 19092 region at the Ks band at 2.17 μm with superimposed SCUBA 850 μm continuum in white contours (from Faustini et al. 2009; Fig. A.16). The small box in the middle represent the area of 1665-MHz OH maser maps shown in the right panel. The OH masers peak flux is 7.24 Jy beam-1 and the contour levels are 0.12 × (4, 8, 16, 32, 60, 120). |
| In the text | |
|
Fig. 2 Positions of the MERLIN 1.6-GHz OH maser features, VLA 44 GHz class I methanol maser features from Kurtz et al. (2004), and MERLIN 6.7 GHz class II methanol masers (Pandian et al. 2011). The symbol that refers to each tracer is shown in the upper left corner of the plot. The plot shows close association between the OH masers and some 6.7-GHz Methanol maser features. The absolute positional accuracies of the MERLIN 1.6-GHz and 6.7-GHz masers are 30 mas (see Sect. 2) and 15 mas, respectively, which is smaller than the size of the symbols. The VLA absolute positional accuracies in RA and Dec associated with the 44 GHz methanol masers are shown by the horizontal and vertical bars, respectively. The origin is at RA (J2000) =19h11m38.974s, Dec (J2000) =+ 08°46′31.09′′. The velocities of the maser features are given. For convenience, the fifth feature of the LHC (~ 14′′ offset) and a far north feature of the 44-GHz (~ 7′′ offset) were not included in this figure. |
| In the text | |
Current usage metrics show cumulative count of Article Views (full-text article views including HTML views, PDF and ePub downloads, according to the available data) and Abstracts Views on Vision4Press platform.
Data correspond to usage on the plateform after 2015. The current usage metrics is available 48-96 hours after online publication and is updated daily on week days.
Initial download of the metrics may take a while.