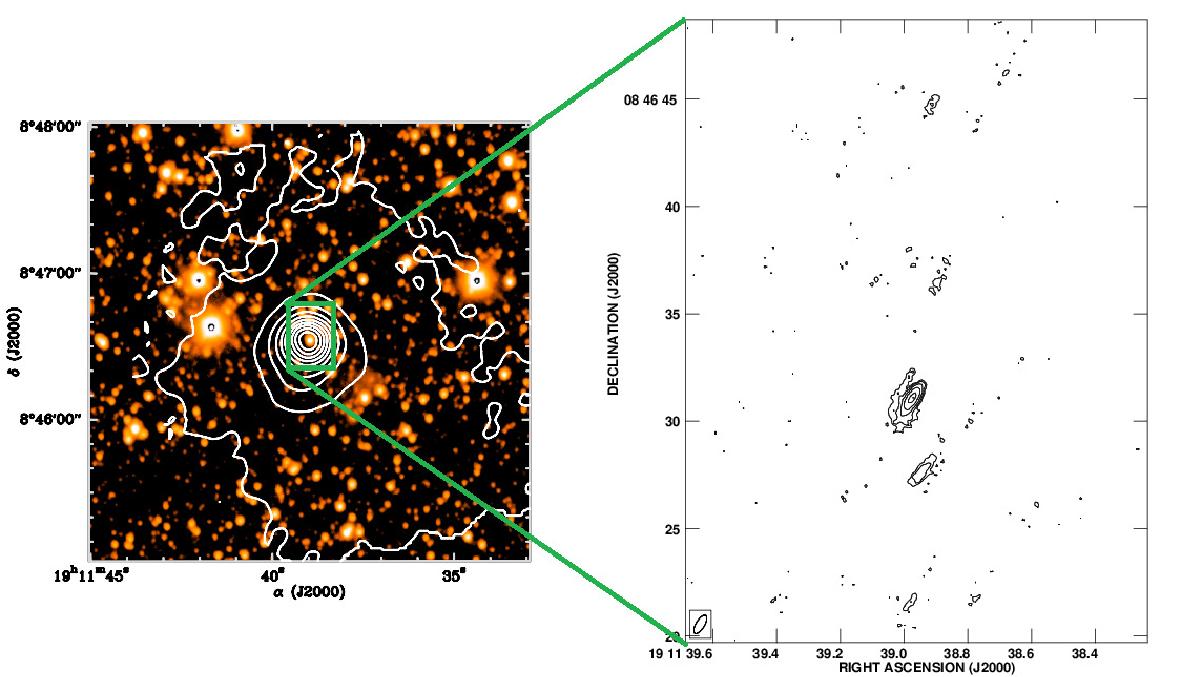
Fig. 1

Left panel: image for the IRAS 19092 region at the Ks band at 2.17 μm with superimposed SCUBA 850 μm continuum in white contours (from Faustini et al. 2009; Fig. A.16). The small box in the middle represent the area of 1665-MHz OH maser maps shown in the right panel. The OH masers peak flux is 7.24 Jy beam-1 and the contour levels are 0.12 × (4, 8, 16, 32, 60, 120).
Current usage metrics show cumulative count of Article Views (full-text article views including HTML views, PDF and ePub downloads, according to the available data) and Abstracts Views on Vision4Press platform.
Data correspond to usage on the plateform after 2015. The current usage metrics is available 48-96 hours after online publication and is updated daily on week days.
Initial download of the metrics may take a while.


